2
$\begingroup$

I am wondering how to create a rectangular pulse with a non linear falling edge on one side, and straight line sloping from the falling edge (the red line).
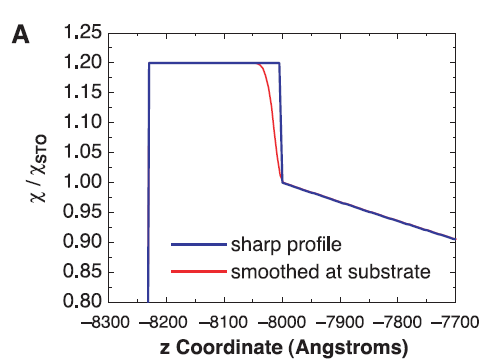
enter image description here

So far I have managed to get the plot without the falling edge by using the ListStepPlot function, but I would like to have one continuous function as I will be applying a Fourier Transform to it. I have seen some ways of making a rectangular pulse with non-linear edges by using Convolve and implementing a Gaussian function, but after playing around with it I can't replicate the graph exactly.

I would also like to be able to change the height of the step as well as the sloping line, and the steepness of the falling edge.

Any help is appreciated! Thanks!

$\endgroup$
7
  • $\begingroup$ mathematica.stackexchange.com/a/234067/72111 $\endgroup$
    – cvgmt
    Commented Mar 24, 2022 at 10:46
  • $\begingroup$ Do you know the equation that the trailing edge is supposed to conform to? $\endgroup$ Commented Mar 24, 2022 at 10:48
  • $\begingroup$ Thanks for the comment @cvgmt! I checked the link, but I would like to have one continuous function instead of a piecewise so that I can perform a Fourier transform on the function. $\endgroup$
    – halce
    Commented Mar 24, 2022 at 10:51
  • $\begingroup$ @image_doctor Do you mean the right side of the graph that is sloping? It is supposed to attenuate with a factor of $e^{-\eta z}$ where $\eta$ is an attenuation constant. $\endgroup$
    – halce
    Commented Mar 24, 2022 at 10:53
  • $\begingroup$ Thank you @halce, is there a reason you don't use that equation directly to form the right hand ( trailing edge ) of the pulse ? $\endgroup$ Commented Mar 24, 2022 at 11:24

1 Answer 1

5
$\begingroup$

I wrote this for this sort of thing. First make a list of points that the function should go through. Then use my MonotonicInterpolation.

points={{-8230.0,1.2},{-8060.0,1.2},{-8050.0,1.1985},{-8042.4,1.19},{-8035.8,1.1701},{-8027.7,1.119},{-8020.3,1.059},{-8012.3,1.0167},{-8007.4,1.006},{-8000.0,1.0},{-7990.0,0.9965},{-7980.0,0.9936},{-7700.0,0.91}};
funct=ResourceFunction["MonotonicInterpolation"][points];
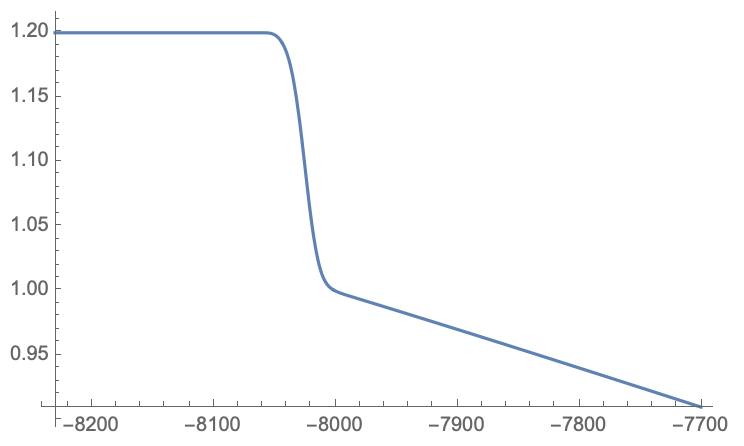
Plot[funct[a],{a,-8230,-7700}]

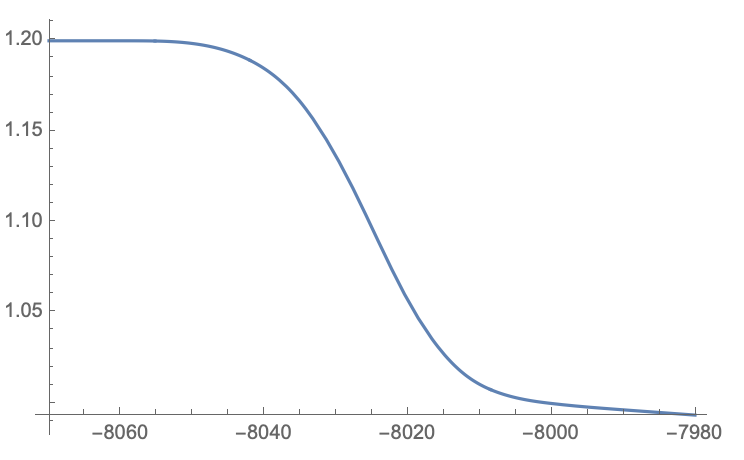
smooth plot Plot up close to see how smooth the function above is.

Plot[funct[a],{a,-8060,-7980}]

smooth plot close up

In Properties and Relations for the MonotonicInterpolation documentation I show how you can ensure linear extrapolation is used beyound the interpolation interval. If you want to convert the InterpolatingFunction above to a Piecewise function use this.

$\endgroup$

Your Answer

By clicking “Post Your Answer”, you agree to our terms of service and acknowledge you have read our privacy policy.

Not the answer you're looking for? Browse other questions tagged or ask your own question.