1
$\begingroup$

I have a function

$$f(x) = a_2 + (a_3 - a_2)\text{cn}^2\left(\frac{\sqrt{a_3 - a_1}}{\sqrt2};m \right)$$

Where $m$ is the modulus, given by $m = (a_3-a_2)/(a_3-a_1)$.

How can I plot this function in Mathematica? I tried but can't get past an error.

m = (a3 - a2)/(a3 - a1)
f[a] = a2*(a3 - a2) JacobiCN[Sqrt[a3 - a1]/Sqrt[2], m];
Plot[f[a], {m, 0, 1}]
$\endgroup$
4
  • $\begingroup$ Welcome to MSE. Please edit your question and add the code you have tried. $\endgroup$ Commented Mar 10, 2022 at 21:31
  • $\begingroup$ Welcome to Mathematica SE. To get started:1) take the introductory tour now,2) when you see good questions and answers, vote them up by clicking the gray triangles, because the credibility of the system is based on the reputation gained by users sharing their knowledge,3) remember to accept the answer, if any, that solves your problem, by clicking checkmark sign,4) give help too, by answering questions in your areas of expertise. $\endgroup$
    – user49048
    Commented Mar 10, 2022 at 21:32
  • 1
    $\begingroup$ Please post the right code about your function f. $\endgroup$
    – cvgmt
    Commented Mar 11, 2022 at 0:57
  • $\begingroup$ just passing by to stress that what @cvgmt asks is important $\endgroup$
    – user49048
    Commented Mar 11, 2022 at 1:52

1 Answer 1

1
$\begingroup$

Firstly you call something a function of $x$, $f(x)$, but there is no $x$-dependence.

The way to code your function is the following

f[a1_, a2_, a3_] := 
 a2 + (a3 - a2) JacobiCN[Sqrt[(a3 - a1)/2], Mod[a3 - a2, a3 - a1]]^2

So, you have a function of the a1, a2 and a3. I am assuming the simple range 0 to 1 for all three of those.

In order to plot it for various values you can try the following:

Manipulate[
 ContourPlot[f[a1, a2, a3], {a1, 0, 1}, {a2, 0, 1}, 
  ColorFunction -> "Rainbow"], {a3, 0, 1}]
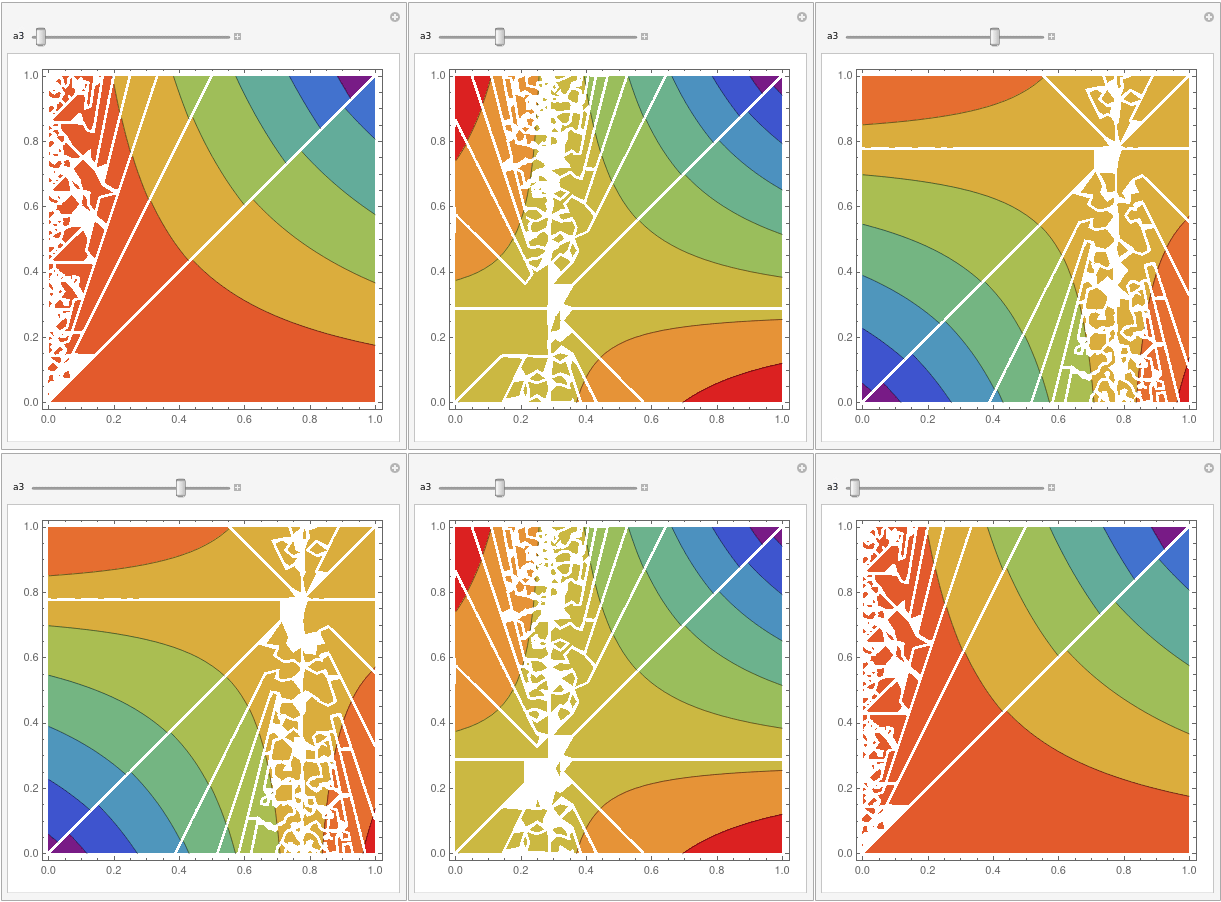
gif

Another way to plot is the following:

Plot3D[Evaluate@Table[f[a1, a2, a3], {a1, {0, 1, 0.1}}], {a2, 0, 
  1}, {a3, 0, 1}, PlotStyle -> {Red, Green, Blue}]
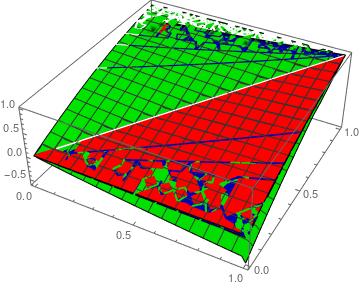
a2

And another way to plot the function

Manipulate[
 Plot3D[f[a1, a2, a3], {a1, 0, 2}, {a2, -1, 2}, 
  Mesh -> Full], {a3, -2, 3}]
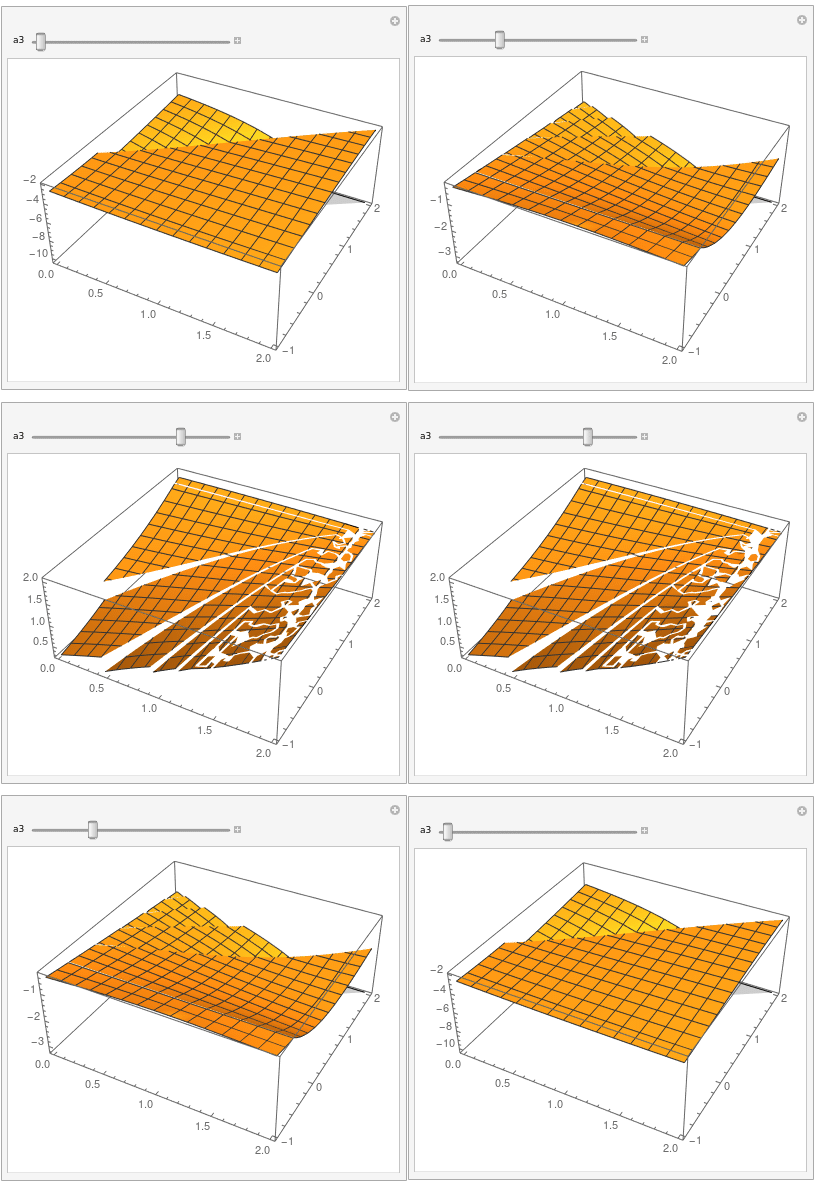
gif2

$\endgroup$
9
  • $\begingroup$ Nice, how would I plot those symbolically, i.e., without passing values? $\endgroup$
    – jimbob97
    Commented Mar 10, 2022 at 21:45
  • $\begingroup$ @jimbob97 not really sure what you mean. How would you plot something without assigning values to the coordinates? If you are worried about the ranges, you can of course increase them, or maybe I misunderstood $\endgroup$
    – user49048
    Commented Mar 10, 2022 at 21:47
  • $\begingroup$ @jimbob97 I made it more concrete with a second way of plotting and also showing how the first plot behaves in a notebook. perhaps you can have a look at the updated version. $\endgroup$
    – user49048
    Commented Mar 10, 2022 at 21:53
  • $\begingroup$ @jimbob97 In your code, {m, 0, 1} mean that 0<=(a3 - a2)/(a3 - a1)<=1 instead of 0<=a1<=1, 0<=a2<=1,0<=a3<=1, please clarify this. $\endgroup$
    – cvgmt
    Commented Mar 11, 2022 at 0:12
  • $\begingroup$ @cvgmt you should also keep in mind that m is Mod. at least this is what was written in the OP and that's why I passed it like this in this answer. $\endgroup$
    – user49048
    Commented Mar 11, 2022 at 0:18

Your Answer

By clicking “Post Your Answer”, you agree to our terms of service and acknowledge you have read our privacy policy.

Not the answer you're looking for? Browse other questions tagged or ask your own question.