2
$\begingroup$

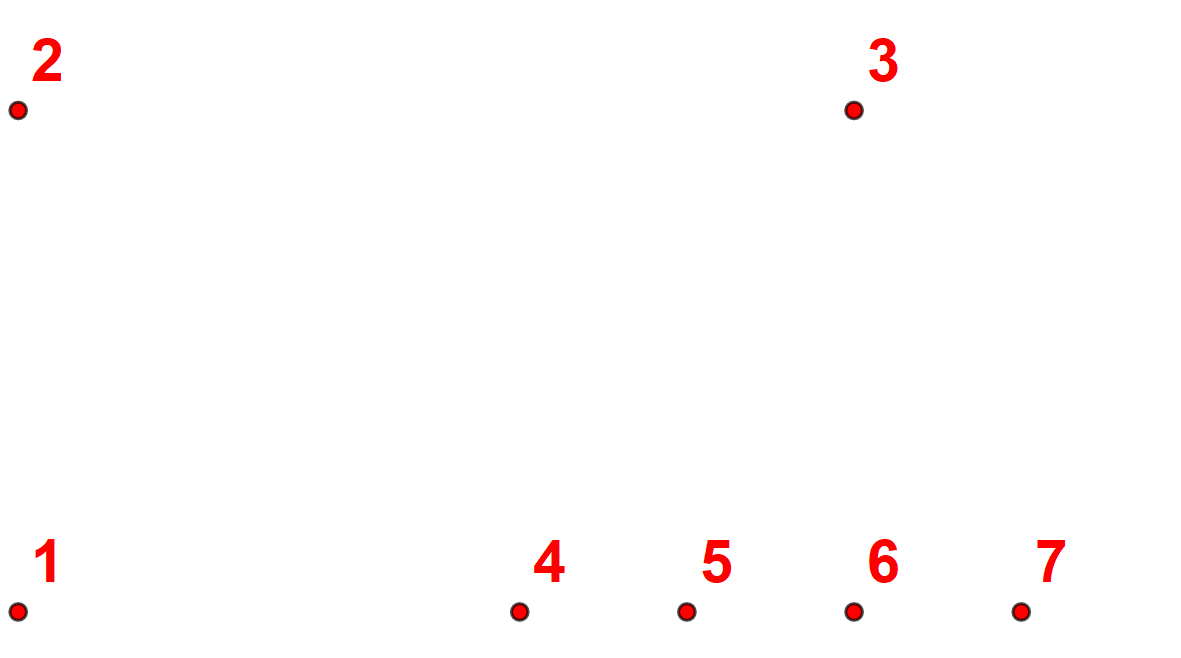
First I plotted this and got a nice graph.

Graph[Range[7], {},
VertexLabels ->
Thread[Range[7] -> (Style[#, Red, 20, Bold] & /@ Range[7])],
VertexSize -> Small, VertexStyle -> Red,
VertexCoordinates -> {1 -> {0, 0}, 2 -> {0, 3}, 3 -> {5, 3}},
EdgeStyle -> Directive[Green, Thickness[0.05]],
EdgeLabelStyle -> Directive[Blue, Bold, 50]]

enter image description here

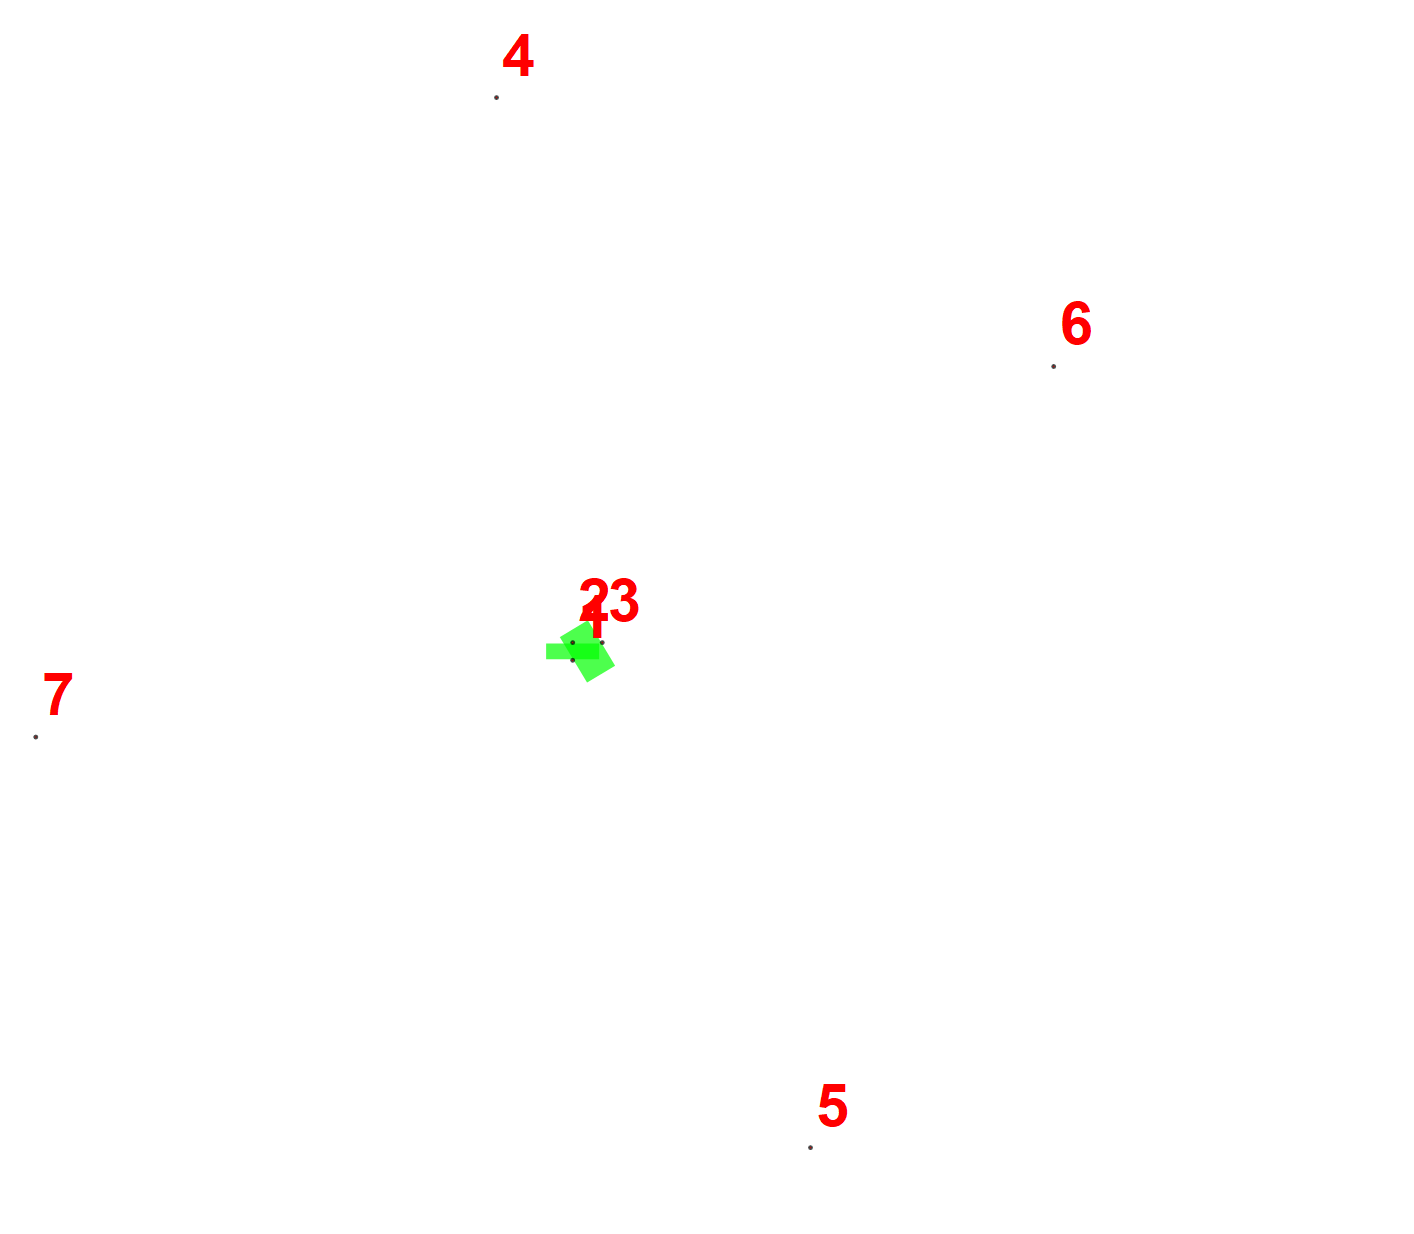
Next I added two edges and it ruined my graph. The vertexcoordinate doesn't seem to work anymore. Does anyone know why and how to fix this?

Graph[Range[7], {1 \[UndirectedEdge] 2, 1 \[UndirectedEdge] 3},
VertexLabels ->
Thread[Range[7] -> (Style[#, Red, 20, Bold] & /@ Range[7])],
VertexSize -> Small, VertexStyle -> Red,
VertexCoordinates -> {1 -> {0, 0}, 2 -> {0, 3}, 3 -> {5, 3}},
EdgeStyle -> Directive[Green, Thickness[0.05]],
EdgeLabelStyle -> Directive[Blue, Bold, 50]]
enter image description here

$\endgroup$

2 Answers 2

3
$\begingroup$

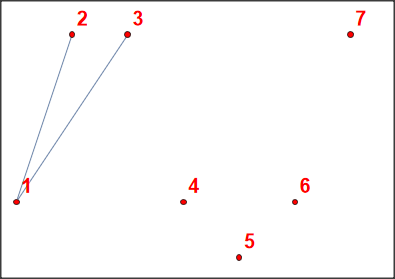
The problem is, that MMA chooses ridiculous large coordinates for vertices without explicitly given coordinates. Why, I do not know. If you specify all coordinates explicitely, you do not have a problem. E.g.

Graph[Range[7], {1 \[UndirectedEdge] 2, 1 \[UndirectedEdge] 3}, 
  VertexLabels -> 
   Thread[Range[7] -> (Style[#, Red, 20, Bold] & /@ Range[7])], 
  VertexSize -> Small, VertexStyle -> Red, 
  VertexCoordinates -> Table[i -> {i, Mod[i^2, 5]}, {i, 7}]]

enter image description here

$\endgroup$
3
$\begingroup$

Define (and visualize) points on a circle with radius 3 (arbitrarily chosen and starting at 20 degrees).

cpts = CirclePoints[{3, 20 Degree}, 7]
Graphics[{Red, AbsolutePointSize[5], Point@cpts}, ImageSize -> Small]

Now use these points as VertexCoordinates. In the first variation, use the cpts.

Graph[Range[7], {1 \[UndirectedEdge] 2, 1 \[UndirectedEdge] 3}
 , VertexLabels -> 
  Thread[Range[7] -> (Style[#, Red, 20, Bold] & /@ Range[7])]
 , VertexCoordinates -> cpts
 , VertexSize -> Small
 , VertexStyle -> Red
 , EdgeStyle -> Directive[Green, AbsoluteThickness[2]]
 , EdgeLabelStyle -> Directive[Blue, Bold, 50]
 (*,PlotRange\[Rule]{{-6,6},{-6,6}}*)
 , ImageSize -> Small
 ]

For the second variation utilize the three given points and join the rest from the cpts.

Graph[Range[7], {1 \[UndirectedEdge] 2, 1 \[UndirectedEdge] 3}
 , VertexLabels -> 
  Thread[Range[7] -> (Style[#, Red, 20, Bold] & /@ Range[7])]
 , VertexCoordinates -> {1 -> {0, 0}, 2 -> {0, 3}, 3 -> {5, 3}}~Join~
   MapThread[Rule, {{4, 5, 6, 7}, cpts[[-4 ;; -1]]}]
 , VertexSize -> Small
 , VertexStyle -> Red
 , EdgeStyle -> Directive[Green, AbsoluteThickness[2]]
 , EdgeLabelStyle -> Directive[Blue, Bold, 50]
 , ImageSize -> Small
 ]

Result:

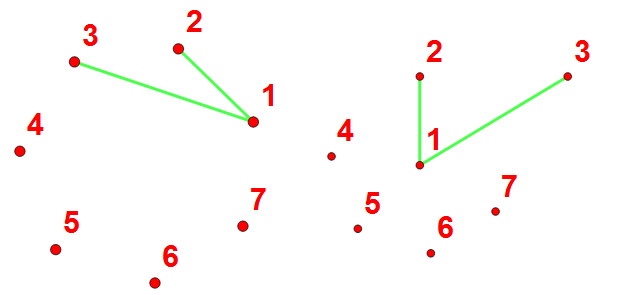
enter image description here

$\endgroup$

Your Answer

By clicking “Post Your Answer”, you agree to our terms of service and acknowledge you have read our privacy policy.

Not the answer you're looking for? Browse other questions tagged or ask your own question.