1
$\begingroup$

There are a number of structurally homogeneous inequalities:

$\begin{array}{l} \left| s_1\right| \leq \sqrt{4 s_2} \\ \left| s_2\right| \leq \sqrt{4 s_4} \\ \left| s_3\right| \leq \sqrt{4 s_6} \\ \left| s_3\right| \leq \sqrt{s_2 s_4} \\ \left| s_4\right| \leq \sqrt{s_2 s_6} \\ \left| s_5\right| \leq \sqrt{s_4 s_6} \\ \end{array}$

n = 4;

A = HankelMatrix[Table[Subscript[s, i], {i, 0, n - 1}], 
   Table[Subscript[s, i], {i, n - 1, 2 n - 2}]];

DeleteDuplicates[DeleteCases[Flatten[Table[Piecewise[{{Abs[A[[i, j]]] <= Sqrt[A[[i, i]] A[[j, j]]], i != j}, {0, i = j}}], {i, 1, n}, {j, 1, n}]], 0]] // Column;

where $s_1,s_3,s_5∈[-2;2]$

$s_2,s_4,s_6>0$ and for example $∈[0;1]$

Then, I plot regions where any of these inequalities hold:

RegionPlot[
 Abs[Subscript[s, 1]] <= Sqrt[4 Subscript[s, 2]], {Subscript[s, 
  1], -2, 2}, {Subscript[s, 2], 0, 1}, ImageSize -> Small]

RegionPlot3D[
 Abs[Subscript[s, 3]] <= Sqrt[
  Subscript[s, 2] Subscript[s, 4]], {Subscript[s, 3], -2, 
  2}, {Subscript[s, 2], 0, 1}, {Subscript[s, 4], 0, 1}, 
 ImageSize -> Small]

RegionPlot3D[
 Abs[Subscript[s, 4]] <= Sqrt[
  Subscript[s, 2] Subscript[s, 6]], {Subscript[s, 2], 0, 
  1}, {Subscript[s, 4], 0, 1}, {Subscript[s, 6], 0, 1}, 
 ImageSize -> Small]

Is it possible to graphically determine the region of intersection of all these inequalities in which they are satisfied?

The most important thing that interests me is that there is some feature in the structure of these inequalities that should give a clear answer on how to handle their solutions. But I can not see it in any way, there is not enough knowledge.

$\endgroup$

2 Answers 2

4
$\begingroup$

Don't understand exactly how you want to get graphical representations, but you can get analytical one.

For simplification is set your LessEqual to Less.

ineqs = {Abs[s1] <= Sqrt[4 s2], Abs[s2] <= Sqrt[4 s4], 
 Abs[s3] <= Sqrt[4 s6], Abs[s3] <= Sqrt[s2 s4], 
 Abs[s4] <= Sqrt[s2 s6], Abs[s5] <= Sqrt[s4 s6]} /. 
Abs -> (Sqrt[#^2] &) /. LessEqual -> Less;

asum = {-2 <= s1 <= 2, -2 <= s3 <= 2, -2 <= s5 <= 2, 0 <= s2 <= 1, 
0 <= s4 <= 1, 0 <= s6 <= 1} /. LessEqual -> Less;

vars = {s1, s2, s3, s4, s5, s6};

Doing reduction in two steps.

red1 = Reduce[Join[ineqs[[{2, 5}]], asum[[4 ;; 6]]], {s2, s4, s6}, 
           Reals]

(*   0 < s2 < 1 && s2^2/4 < s4 < Sqrt[s2] && s4^2/s2 < s6 < 1   *)

red2 = Reduce[
   Join[ineqs[[{1, 3, 4, 6}]], asum[[1 ;; 3]], List @@ red1], vars, 
        Reals];

TraditionalForm[
red2 //. Or -> 
Composition[(Column[#, Right, Background -> {{White, LightGray}}, 
   Frame -> All] &), List]]

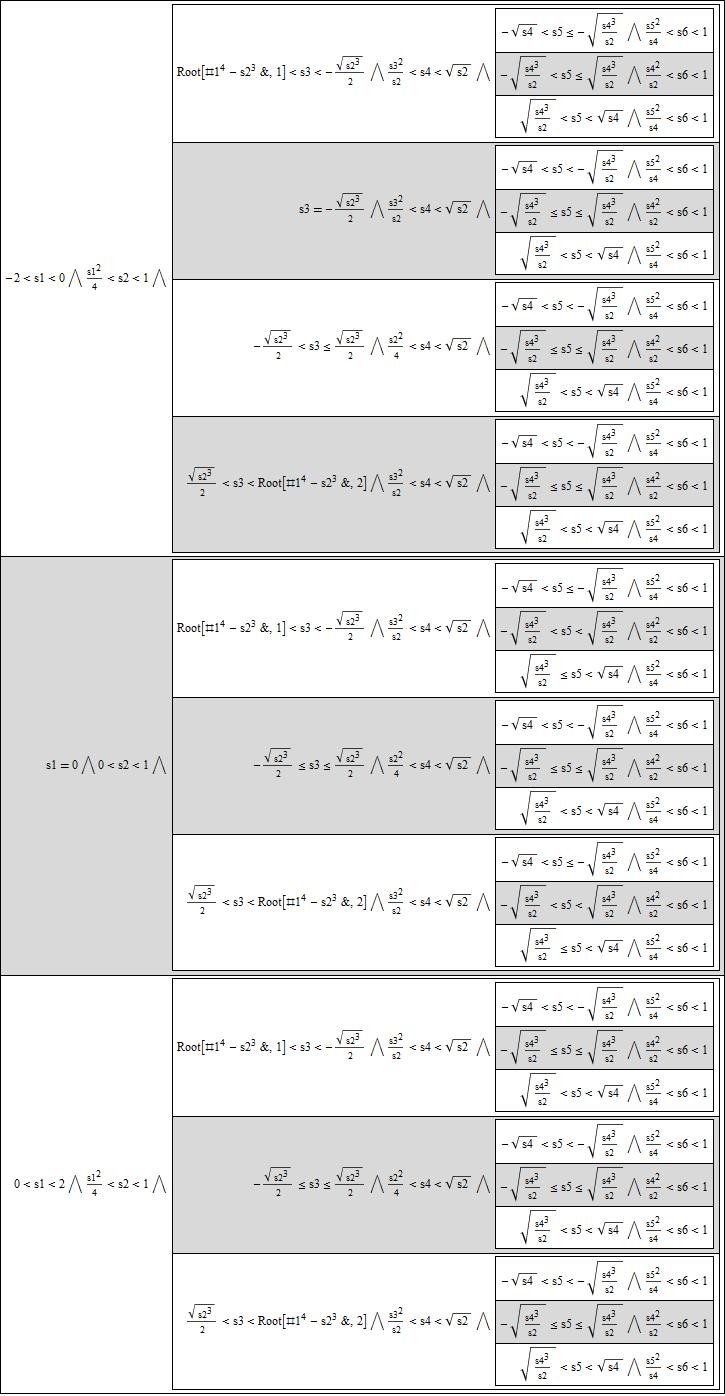
enter image description here

May be the different representations help you to get the overview you are looking for.

 TraditionalForm[
 Simplify[red2] //. 
 Or -> Composition[(Column[#, Right, 
    Background -> {{White, LightGray}}, Frame -> All] &),  List]];

 red3 = LogicalExpand@red2;

 red4 = Reduce@LogicalExpand@red2;

TraditionalForm[
red3 //. Or -> 
Composition[(Column[#, Right, Background -> {{White, LightGray}}, 
    Frame -> All] &), List]];

 TraditionalForm[
 red4 //. Or -> 
 Composition[(Column[#, Right, Background -> {{White, LightGray}}, 
    Frame -> All] &), List]];

 {fi2 = FindInstance[red2, vars, 10], ineqs /. fi2}

{fi3 = FindInstance[red3, vars, 10], ineqs /. fi3}

Edit

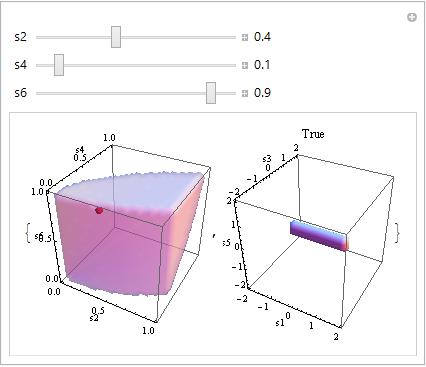
One possibiliy for graphical output. Regard s2,s4,s6 (left graph) and s1,s3,s5 (right graph) regions separatly. The red point shows where you are in the s2,s4,s6 region, graph label (at right graph) says, wether you are in the allowed s2,s4,s6-region and right graph shows how s1,s3,s5 region looks like for choosen s2,s4,s6.

rr1[s2_, s4_, s6_] = red1;
rr2[s1_, s2_, s3_, s4_, s5_, s6_] = red2;
rp1 = RegionPlot3D[
rr1[s2, s4, s6], {s2, 0, 1}, {s4, 0, 1}, {s6, 0, 1}, 
PlotPoints -> 30, PlotStyle -> Opacity -> .5, Mesh -> False, 
AxesLabel -> {"s2", "s4", "s6"}];

Manipulate[{Show[rp1, 
Graphics3D[{PointSize[.05], Red, Sphere[{s2, s4, s6}, .03]}]], 
RegionPlot3D[
Evaluate[rr2[s1, s2, s3, s4, s5, s6]], {s1, -2, 2}, {s3, -2, 
2}, {s5, -2, 2}, PlotPoints -> 30, Mesh -> False, 
AxesLabel -> {s1, s3, s5}, 
PlotLabel :> rr1[s2, s4, s6]]}, {{s2, .4}, 0, 1, 
Appearance -> "Labeled"}, {{s4, .1}, 0, 1, 
Appearance -> "Labeled"}, {{s6, .9}, 0, 1, Appearance -> "Labeled"}]

enter image description here

Get minima/maxima.

(minmax = {Minimize[{#, red2}, {s1, s2, s3, s4, s5, s6}], 
   Maximize[{#, red2}, {s1, s2, s3, s4, s5, s6}]} & /@ {s1, s2, 
  s3, s4, s5, s6} // Quiet) // MatrixForm
$\endgroup$
4
  • $\begingroup$ Thank you for your reply! You correctly caught my message: I am also trying to find the most convenient representation for further work, but so far I have not been able to do this without qualified help. As for visualization, it's my dream to learn how to visualize any $nD$-plots. It is a pity that we live in a 3-dimensional world :)) $\endgroup$
    – ayr
    Commented Jan 30, 2022 at 13:07
  • $\begingroup$ Oh yes, I forgot to add. I've looked at different command options. FindInstance too, with its help I hoped to solve this problem, however, the solution spaces turn out to be so complex that they are difficult to describe analytically. Sometimes. $\endgroup$
    – ayr
    Commented Jan 30, 2022 at 13:09
  • $\begingroup$ I have a question. And what is the role of the MinMax command here? $\endgroup$
    – ayr
    Commented Feb 2, 2022 at 7:12
  • 1
    $\begingroup$ I played a litte. To show, that these can be found analytically. May be to see what variable ranges are not allowed at all. $\endgroup$
    – Akku14
    Commented Feb 2, 2022 at 7:54
3
$\begingroup$

It is difficult to plot such intersection region since it is high-dimensions.

Here we use FindInstance to find some points in such region.

ineqs = {Abs[s[1]] <= Sqrt[s[0] s[2]], Abs[s[2]] <= Sqrt[s[0] s[4]], 
   Abs[s[3]] <= Sqrt[s[0] s[6]], Abs[s[3]] <= Sqrt[s[2] s[4]], 
   Abs[s[4]] <= Sqrt[s[2] s[6]], Abs[s[5]] <= Sqrt[s[4] s[6]]};

(* reg = ImplicitRegion[
   Join[ineqs, {s[0] == 4}, -2 <= {s[1], s[3], s[5]} <= 2 // Thread, 
    0 <= {s[2], s[4], s[6]} <= 1 // Thread], 
   Evaluate@Array[s, 7, 0]];
FindInstance[Array[s, 7, 0] ∈ reg, Array[s, 7, 0]]
 *)
instances = 
 FindInstance[
  Join[ineqs, {s[0] == 4}, -2 <= {s[1], s[3], s[5]} <= 2 // Thread, 
   0 <= {s[2], s[4], s[6]} <= 1 // Thread], Array[s, 7, 0]];
ineqs /. instances[[1]]

{True, True, True, True, True, True}

$\endgroup$
0

Your Answer

By clicking “Post Your Answer”, you agree to our terms of service and acknowledge you have read our privacy policy.

Not the answer you're looking for? Browse other questions tagged or ask your own question.