5
$\begingroup$

I have a list:

histx={-56.6335, -57.2327, -57.8607, -57.9682, -57.0061, -57.1872,-56.9209, -56.1284,...};

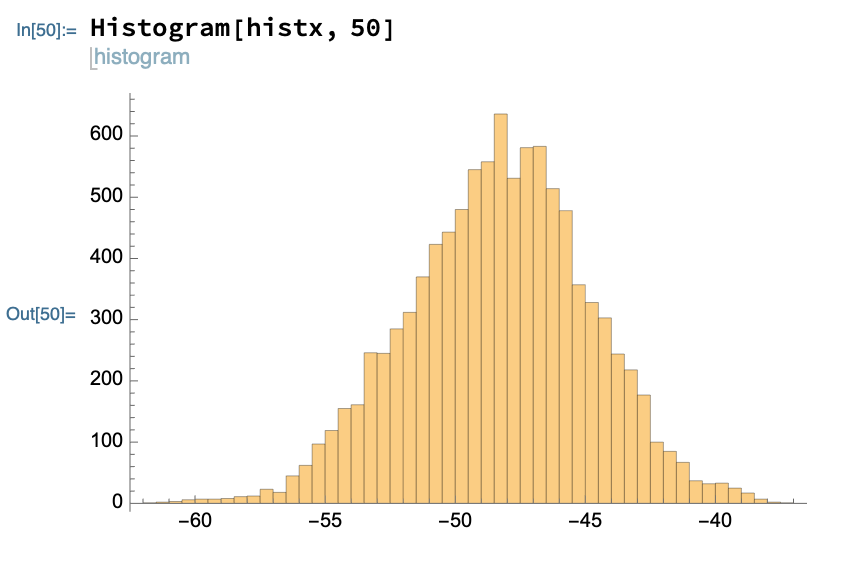
I managed to create the histogram that I wanted to:

enter image description here

But I have a problem with fitting gaussian to it:

enter image description here

How list should be defined to get NonlinearModelFit?

$\endgroup$
2
  • $\begingroup$ You did not include histx in the NonlinearModelFit. When posting questions, include a minimal working example to include a representative (but not necessarily complete) data set that reproduces the problem that you are experiencing. $\endgroup$
    – Bob Hanlon
    Commented Jan 18, 2022 at 17:59
  • $\begingroup$ You have a bigger problem and that is using a regression function (NonlinearModelFit) to fit a histogram. If you really have a normal distribution, all you need to do is calculate the mean and standard deviation. $\endgroup$
    – JimB
    Commented Jan 18, 2022 at 18:16

2 Answers 2

9
$\begingroup$

It is rare than anyone should use a regression function such as NonlinearModelFit to estimate the parameters of a histogram (constructed from a random sample from some probability distribution). If you found that technique in a current class, you should chastise the instructor.

If you have the raw data (rather than just the counts from a histogram which you appear to have), the raw data should be used. If you know you have a simple random sample from a normal distribution, then the following should be used to obtain the maximum likelihood estimates (mle):

SeedRandom[12345];
mle = FindDistributionParameters[histx, NormalDistribution[μ, σ]]
(* {μ -> -47.9086, σ -> 4.03062}  *)

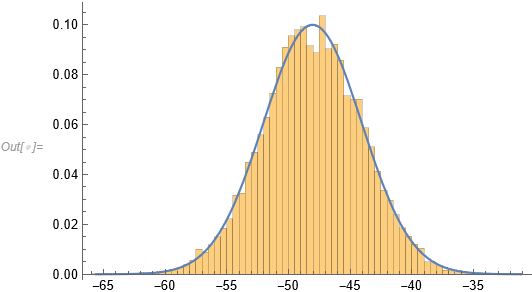
Show[Histogram[histx, "FreedmanDiaconis", "PDF"],
 Plot[PDF[NormalDistribution[μ, σ] /. mle, x], {x, Min[histx], Max[histx]}]]

Histogram and estimated pdf

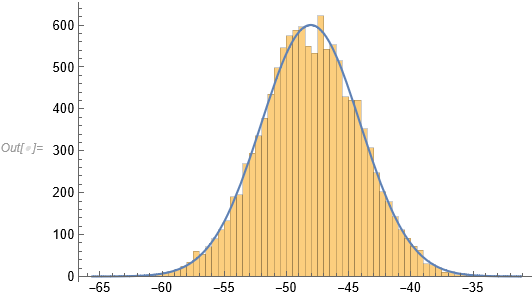
Here you get an estimate of the probability density function. If you really need the vertical scale to be in "counts":

binwidth = Differences[HistogramList[histx, "FreedmanDiaconis"][[1]]][[1]];
Show[Histogram[histx, "FreedmanDiaconis"],
 Plot[Length[histx] binwidth PDF[NormalDistribution[μ, σ] /. mle, x], {x, Min[histx], Max[histx]}]]

Histogram and pdf scaled to give a "count" scale

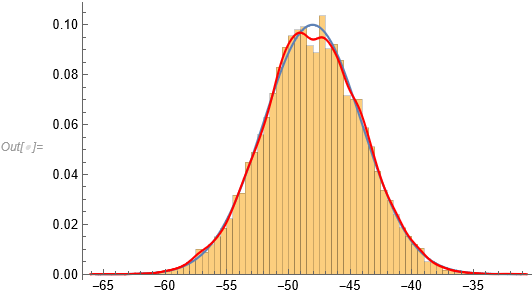
And now in the 21st century you should forget about histograms and use nonparametric density estimates especially given that you seem to have a large number of data points (you seem to have something on the order of 12,000 observations?).

Show[Histogram[histx, "FreedmanDiaconis", "PDF"],
  Plot[PDF[NormalDistribution[\[Mu], \[Sigma]] /. mle, x], {x, Min[histx], Max[histx]}],
  SmoothHistogram[histx, PlotStyle -> Red]]

Histogram, smooth histogram, and normal pdf

$\endgroup$
2
  • $\begingroup$ I have also second question, how to make 90 degree rotated axes labels? $\endgroup$ Commented Jan 26, 2022 at 23:31
  • $\begingroup$ That would be a new question. $\endgroup$
    – JimB
    Commented Jan 27, 2022 at 1:33
7
$\begingroup$

We can use FindDistribution as shown below. Before applying that function though, I am going to find the empirical distribution based on the image of the histogram.

Get the image points

Crop the image (using Mathematica's interactive image manipulation tools):
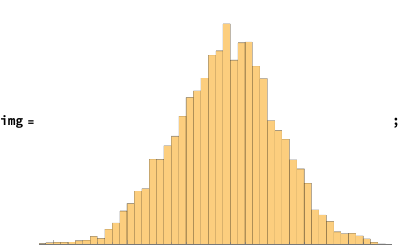
enter image description here

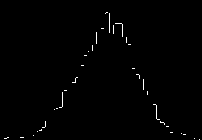
Binarize and edge detect:

img2 = EdgeDetect[Binarize[img], 3];
img2
enter image description here

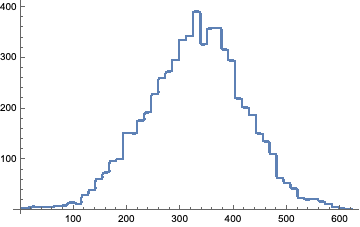
Get the corresponding “white” points:

lsPoints = Position[ImageData[img2], 1];
lsPoints2 = Map[{#[[1]], ImageDimensions[img2][[2]] - #[[2]]} &, Reverse /@ lsPoints];
ListPlot[lsPoints2]
enter image description here

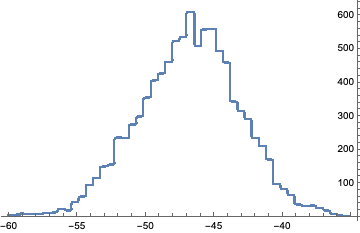
Rescale into the histogram image ranges:

lsPoints3 = N@Transpose[{Rescale[lsPoints2[[All, 1]], MinMax[lsPoints2[[All, 1]]], {-60, -35}], Rescale[lsPoints2[[All, 2]], MinMax[lsPoints2[[All, 2]]], {0, 610}]}];
Length[lsPoints3]
ListPlot[lsPoints3]

(*2043*)
enter image description here

Estimate the number of points

Aggregate by the x-coordinate and find the means of the corresponding y-coordinates:

lsPoints4 = Sort@Values[GroupBy[lsPoints3, First, {#[[1, 1]], Mean[#[[All, 2]]]} &]];
Length[lsPoints4]

(*622*)

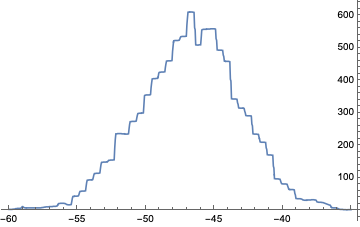
Make an interpolation function:

ifunc = Interpolation[lsPoints4, InterpolationOrder -> 1]

enter image description here

Plot[ifunc[x], {x, lsPoints4[[1, 1]], lsPoints4[[-1, 1]]}]
enter image description here

Find the width for each bin:

Tally[Differences[lsPoints4[[All, 1]]]]

(*{{0.0402576, 559}, {0.0402576, 62}}*)
binWidth = Mean[Differences[lsPoints4[[All, 1]]]]

(*0.0402576*)

Well, this bin width estimation is more of an artifact of EdgeDetect; the histogram bin seems to be a few times wider.

Here is the estimate for total sum of points:

nPoints = Ceiling[Total[lsPoints4[[All, 2]]]/4]

(* 31350 *)

Generate “histogram image estimated” points

Generate the points:

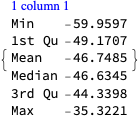
lsIntervals = RandomChoice[lsPoints4[[All, 2]] -> lsPoints4[[All, 1]], Floor[nPoints/10]];
ResourceFunction["RecordsSummary"][lsIntervals]
enter image description here

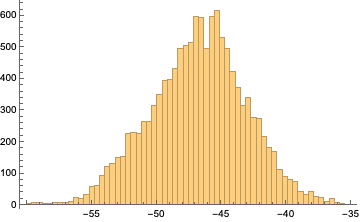
lsGeneratedPoints = RandomReal[{#, # + binWidth}] & /@ lsIntervals;
Histogram[lsGeneratedPoints, {lsPoints4[[1, 1]], lsPoints4[[-1, 1]], 10 binWidth}]
enter image description here

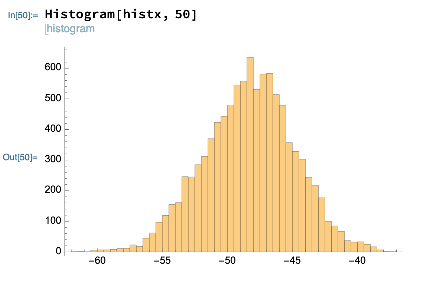
Here is the original image with the histogram (looks close enough):

img0
enter image description here

Find the distribution

Over the generated points above we apply FindDistribution:

FindDistribution[lsGeneratedPoints]

(*NormalDistribution[-46.7283, 3.68475]*)

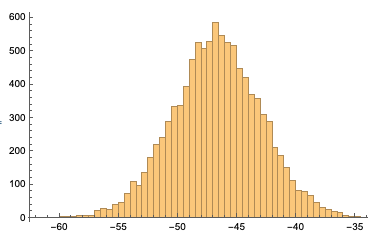
Verification

SeedRandom[6];
Histogram[
 RandomVariate[
  NormalDistribution[-46.728321499135916`, 3.684750636542824`], 10000], 50]
enter image description here

$\endgroup$
2
  • 1
    $\begingroup$ +1 It is amazing that one can "digitize" the values of a histogram figure and extract the counts and bin boundaries. $\endgroup$
    – JimB
    Commented Jan 19, 2022 at 0:58
  • $\begingroup$ @JimB Thanks! I consider these kind of applications to be not that easy to do in the "competitor" systems, Julia, Python, and R. (I plan to renew my blog posts on comparisons between them.) $\endgroup$ Commented Jan 19, 2022 at 13:44

Your Answer

By clicking “Post Your Answer”, you agree to our terms of service and acknowledge you have read our privacy policy.

Not the answer you're looking for? Browse other questions tagged or ask your own question.