1
$\begingroup$

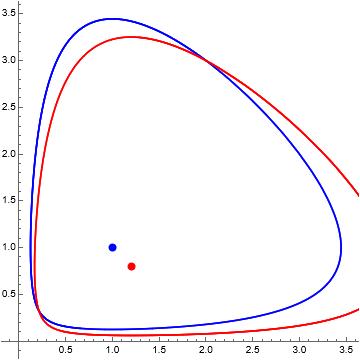
I have to solve the next problem: We know that a=b=c=d=1 and x0=2,y0=3,q=0.2,On the t=[0,20] interval there is no fishing but on the t=[20,40] interval there is.Show the adequate trajectory(the first one is blue,the second is red)the equilibrium points(blue and red),and the point coresponding to the transition(green).

And after solving this we should get the next graph: enter image description here
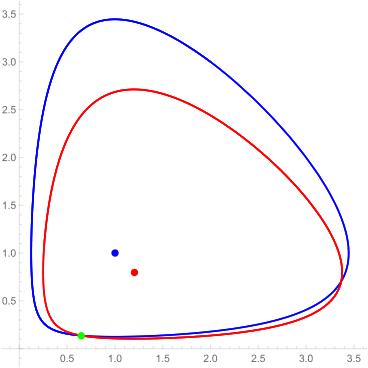
Here is my take on it,but for some reason the red trajectory is off and I don't know how to find the green point.

a = b = c = d = 1;
x0 = 2;
y0 = 3;
q = 0.2;
egyensulypont1 = 
  Graphics[{Blue, Thick, PointSize[0.02], Point[{c/d, a/b}]}];
egyensulypont2 = 
  Graphics[{Red, Thick, PointSize[0.02], 
    Point[{(c + q)/d, (a - q)/b}]}];
Soln = NDSolve[{x'[t] == a*x[t] - b*x[t]*y[t], 
   y'[t] == -c*y[t] + d*x[t]*y[t], x[0] == x0, y[0] == y0}, {x, 
   y}, {t, 0, 20}]

Solh = NDSolve[{x'[t] == (a - q)*x[t] - b*x[t]*y[t], 
   y'[t] == -(c + q)*y[t] + d*x[t]*y[t], x[0] == x0, y[0] == y0}, {x, 
   y}, {t, 20, 40}]
Show[ParametricPlot[{x[t], y[t]} /. Soln, {t, 0, 20}, 
  PlotStyle -> Blue], 
 ParametricPlot[{x[t], y[t]} /. Solh, {t, 20, 40}, 
  PlotStyle -> Red], egyensulypont1, egyensulypont2]

And this is the graph that I got: enter image description here

$\endgroup$
2
  • 1
    $\begingroup$ You need to use the final value of Soln as the initial condition of Solh, instead of using the same initial condition of {x0, y0}. That is also the green point. $\endgroup$
    – Chris K
    Commented Nov 22, 2021 at 19:29
  • 1
    $\begingroup$ Could you please write it down? $\endgroup$
    – Birgitt
    Commented Nov 22, 2021 at 19:37

1 Answer 1

3
$\begingroup$

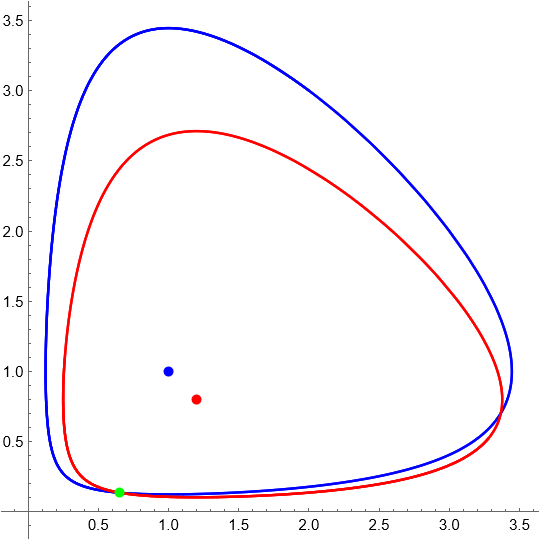
This is what Chris means:

a = b = c = d = 1;
x0 = 2;
y0 = 3;
q = 0.2;
egyensulypont1 = 
  Graphics[{Blue, Thick, PointSize[0.02], Point[{c/d, a/b}]}];
egyensulypont2 = 
  Graphics[{Red, Thick, PointSize[0.02], 
    Point[{(c + q)/d, (a - q)/b}]}];
egyensulypont3 = 
  Graphics[{Green, Thick, PointSize[0.02], 
    Point[({x[t], y[t]} /. Soln /. t -> 20)]}];
Soln = NDSolve[{x'[t] == a*x[t] - b*x[t]*y[t], 
   y'[t] == -c*y[t] + d*x[t]*y[t], x[0] == x0, y[0] == y0}, {x, 
   y}, {t, 0, 20}]

Solh = NDSolve[{x'[t] == (a - q)*x[t] - b*x[t]*y[t], 
   y'[t] == -(c + q)*y[t] + d*x[t]*y[t], 
   x[0] == ({x[t], y[t]} /. Soln /. t -> 20)[[1, 1]], 
   y[0] == ({x[t], y[t]} /. Soln /. t -> 20)[[1, 2]]}, {x, y}, {t, 20, 40}]
Show[ParametricPlot[{x[t], y[t]} /. Soln, {t, 0, 20}, 
  PlotStyle -> Blue], 
 ParametricPlot[{x[t], y[t]} /. Solh, {t, 20, 40}, 
  PlotStyle -> Red], egyensulypont1, egyensulypont2, egyensulypont3]

enter image description here

$\endgroup$
1
  • 1
    $\begingroup$ Thank you so much! $\endgroup$
    – Birgitt
    Commented Nov 22, 2021 at 20:49

Your Answer

By clicking “Post Your Answer”, you agree to our terms of service and acknowledge you have read our privacy policy.

Not the answer you're looking for? Browse other questions tagged or ask your own question.