5
$\begingroup$

I was answering different question How Can I Visualize a PDE Boundary Condition? and in the process, found that DSOlve solution to the laplace PDE does not agree with the BC.

Then I tried NDSolve and the plot now shows agreement.

Did I do something wrong here, or could this be a bug in DSolve?

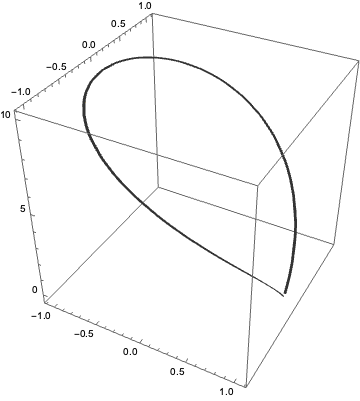
First, here is plot of the BC on its own

ClearAll [theta, r, u]
bcf = 2*Pi*theta - theta^2;
ParametricPlot3D[{r Cos[theta], r Sin[theta], bcf}, {r, 1 - .01, 
  1 + .01}, {theta, 0, 2 Pi}, BoxRatios -> {1, 1, 1}]
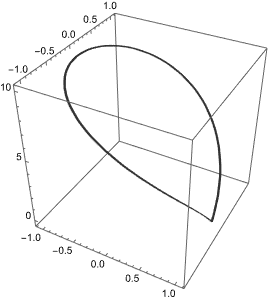
Mathematica graphics

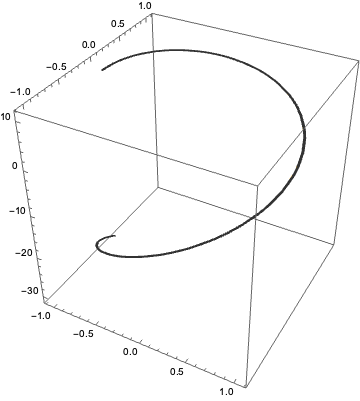
Hence the solution to the PDE should match the above on the BC. But it does not:

ClearAll [theta, r, u]
pde = Laplacian[u[r, theta], {r, theta}, "Polar"] == 0;
bcf = 2*Pi*theta - theta^2;
bc = u[1, theta] == bcf;
sol = u[r, theta] /. First@DSolve[{pde, bc}, u[r, theta], {r, theta}];
sol = sol /. K[1] -> n;
sol = sol /. Infinity -> 50 (*more than enough terms*)

Mathematica graphics

Plotting the solution with the BC together shows mismatch on some interval

Show[
 ParametricPlot3D[{r Cos[theta], r Sin[theta], Activate[sol]}, {r, 0, 
   1}, {theta, 0, 2 Pi}, PlotStyle -> Opacity[.6], 
  BoxRatios -> {1, 1, 1}],
 ParametricPlot3D[{r Cos[theta], r Sin[theta], bcf}, {r, 1 - 0.1, 
   1 + 0.1}, {theta, 0, 2 Pi}, PlotStyle -> Opacity[1], 
  BoxRatios -> {1, 1, 1}], PlotRange -> All
 ]
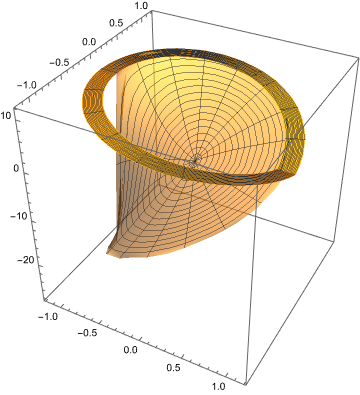
Mathematica graphics

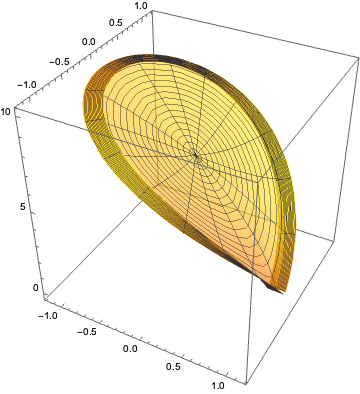
Now compare with NDSolve for same PDE and same BC

solNumerical = 
 First@NDSolve[{pde, bc}, u, {r, 0, 1}, {theta, 0, 2 Pi}];

Show[
 ParametricPlot3D[{r Cos[theta], r Sin[theta], 
   Evaluate[u[r, theta] /. solNumerical]}, {r, 0, 1}, {theta, 0, 
   2 Pi}, PlotStyle -> Opacity[1], BoxRatios -> {1, 1, 1}],
 ParametricPlot3D[{r Cos[theta], r Sin[theta], bcf}, {r, 1 - 0.1, 
   1 + 0.1}, {theta, 0, 2 Pi}, PlotStyle -> Opacity[1], 
  BoxRatios -> {1, 1, 1}], PlotRange -> All
 ]
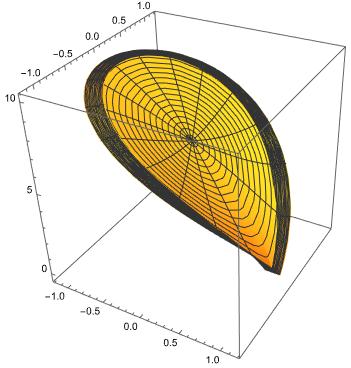
Mathematica graphics

What is going on? Why DSolve solution does not agree with BC? Did I make mistake somewhere?

V 12.3.1 on windows 10

$\endgroup$
2
  • $\begingroup$ Looks to me like Mathematica might be taking the range $\theta \in [-\pi, \pi]$ rather than $\theta \in [0, 2 \pi]$. Also you didn't apply the BCs correctly; none of the constants $a_n$ (including $a_0$) should depend on $\theta$. $\endgroup$ Commented Sep 27, 2021 at 20:08
  • $\begingroup$ @MichaelSeifert I think you are right, I will remove my hand solution for now. But still, I do not understand why DSolve solution does not agree with BC. Will try with theta from -PI to Pi to see if this makes a difference. $\endgroup$
    – Nasser
    Commented Sep 27, 2021 at 20:13

1 Answer 1

12
$\begingroup$

The "Polar" coordinates programmed into Mathematica implicitly assume that the $\theta$ coordinate runs between -π and π, not between 0 and 2π as your initial ParametricPlot assumed:

CoordinateChartData["Polar", "CoordinateRangeAssumptions"]

(* #1[[1]] > 0 && -\[Pi] < #1[[2]] <= \[Pi] & *)

In particular, this means that Mathematica is assuming that the value at the boundary should range from $-3 \pi^2$ as $\theta \to - \pi$ from above all the way to $\pi^2$ as $\theta \to +\pi$ from below. In other words, it thinks you want this boundary condition:

ParametricPlot3D[{r Cos[theta], r Sin[theta], bcf}, {r, 1 - .01, 1 + .01}, 
  {theta, -Pi,  Pi}, BoxRatios -> {1, 1, 1}]

enter image description here

(Note the change in the range of theta in the plot; everything else is the same as it was before.) This is why you see the large discontinuity along the boundary of Mathematica's solution. It also explains why the plot agrees for points in quadrants I & II (where your definition of $\theta$ agrees with Mathematica's) but disagrees in quadrants III & IV (where you assume that $\pi < \theta < 2 \pi$ but Mathematica is assuming that $-\pi < \theta < 0$.)

To implement the BCs that you originally wanted in a way that is compatible with Mathematica's assumptions about coordinate ranges, you would use:

newbcf[theta_] = Piecewise[{{2*Pi*theta - theta^2, 0 <= theta <= Pi}, {-2*Pi*theta - theta^2, -Pi < theta < 0}},0]
ParametricPlot3D[{r Cos[theta], r Sin[theta], newbcf[theta]}, {r, 1 - .01, 1 + .01}, 
  {theta, -Pi,  Pi}, BoxRatios -> {1, 1, 1}]

enter image description here

Using the same code you used, but with bcf replaced with newbcf[theta], yields a solution of

enter image description here

and plotting this using your code (changing the range of $\theta$ to run from -π to π) yields a correct-looking plot:

enter image description here

$\endgroup$
5
  • $\begingroup$ What's the explanation for why Mathematica is even using "Polar" coordinates in the first place? With no boundary conditions given for theta, it just assumes that periodic boundary conditions are desired? $\endgroup$
    – Carmeister
    Commented Sep 28, 2021 at 18:23
  • $\begingroup$ @Carmeister: "Polar" is invoked in the OP's attempt to use DSolve: pde = Laplacian[u[r, theta], {r, theta}, "Polar"] == 0. I would assume that internally, this is equivalent to saying that u satisfies the Laplacian in polar coordinates and that there are period boundary conditions that match the $\theta = -\pi$ and $\theta = \pi$ lines. In contrast, in the second solution (with NDSolve), the OP explicitly wrote out the Laplacian in polar coordinates and provided the boundary conditions they wanted. $\endgroup$ Commented Sep 28, 2021 at 18:31
  • $\begingroup$ The "Polar" there isn't an input to DSolve though: it just gives the Laplacian in polar coordinates. The output is (Derivative[0, 2][u][r, theta]/r + Derivative[1, 0][u][r, theta])/r + Derivative[2, 0][u][r, theta] with no reference to polar coordinates anymore. $\endgroup$
    – Carmeister
    Commented Sep 28, 2021 at 18:36
  • $\begingroup$ @Carmeister: .... Hmm. That's a darn good point. I'll have to think on that. $\endgroup$ Commented Sep 28, 2021 at 18:45
  • 1
    $\begingroup$ After doing a bit of experimenting, it seems Mathematica will make some assumptions about your region/boundary conditions for some simple cases, including this one. For example DSolve[{Laplacian[u[x, y], {x, y}] == 0, u[x, 0] == 1/(1 + x^2)}, u[x, y], {x, y}] will happily assume that the desired region is the upper half-plane and solve the PDE there, but it balks if the boundary condition is replaced by u[x, 1] == 1/(1 + x^2)} unless I explicitly give it a region. I'm not sure if this behavior is documented anywhere. $\endgroup$
    – Carmeister
    Commented Sep 28, 2021 at 19:11

Your Answer

By clicking “Post Your Answer”, you agree to our terms of service and acknowledge you have read our privacy policy.

Not the answer you're looking for? Browse other questions tagged or ask your own question.