10
$\begingroup$

This is a follow-up question to this one on visualizing vector-spherical harmonics. This time, I would like to visualize the vector spherical waves (including the radial dependence). The functions that I would like to plot, VectorSphericalWaveE[J, M, kr, θ, ϕ] and VectorSphericalWaveM[J, M, kr, θ, ϕ] are defined below. Please note there was a typo in ϵ[λ_], in the linked question, which I have corrected.

Clear[ϵ]; (*Polarization vector*)
ϵ[λ_] = Switch[λ,
   -1, {1, -I, 0}/Sqrt[2],
    0, {0, 0, 1},
    1, -{1, I, 0}/Sqrt[2]   ];

Clear[VectorSphericalHarmonicV];
VectorSphericalHarmonicV[ℓ_, J_, M_, θ_, ϕ_] /; 
  J >= 0 && ℓ >= 0 && Abs[J - ℓ] <= 1 && Abs[M] <= J :=
   Sum[
    If[Abs[M - λ] <= ℓ, ClebschGordan[{ℓ, M - λ}, {1, λ}, {J, M}], 0]*
    SphericalHarmonicY[ℓ, M - λ, θ, ϕ]*ϵ[λ], {λ, -1, 1}   ]

Clear[RadialR, VectorSphericalWaveE,VectorSphericalWaveM];
RadialR[kr_, ℓ_] = I^ℓ SphericalBesselJ[ℓ, kr];
VectorSphericalWaveE[J_, M_, kr_, θ_, ϕ_] /;  J >= 0 && Abs[M] <= J := 
  If[J > 0, -Sqrt[((J + 1)/(2 J + 1))] SphericalBesselJ[J - 1, kr] VectorSphericalHarmonicV[J - 1, J, M, θ, ϕ],  0] 
+ Sqrt[J/(2 J + 1)] SphericalBesselJ[J + 1, kr] VectorSphericalHarmonicV[J + 1, J, M, θ, ϕ];
VectorSphericalWaveM[J_, M_, kr_, θ_, ϕ_] /; J >= 0 && Abs[M] <= J := 
  I SphericalBesselJ[J, kr] VectorSphericalHarmonicV[J, J, 
    M, θ, ϕ];

The functions VectorSphericalWaveE and VectorSphericalWaveM takes two integer arguments $J\geq 1$ and $-J\leq M \leq J$, and three continuous arguments: the radial coordinate $kr>0$, and the angular coordinates $\theta$ and $\phi$. The output is a real vector.

Because these functions give out real-valued vectors, I would like to visualize them using vector plot.

I tried the following:

VectorPlot3D[
 Re[VectorSphericalWaveM[2, 1, 
 Sequence @@ CoordinateTransform["Cartesian" -> "Spherical", {x, y, z}]]],
     {x, -5, 5}, {y, -5, 5}, {z, -5, 5},
     RegionFunction -> ((#1^2 + #2^2 + #3^2 <= 5^2) &)]

But got a crummy output (see below). I can hardly tell what's going on. I know these vector fields are supposed to be circulatory only, so it would be nice if that aspect can be emphasized in the plot. Also, is there a way to include some kind of distance fog, so that arrows in the back, are greyed out?
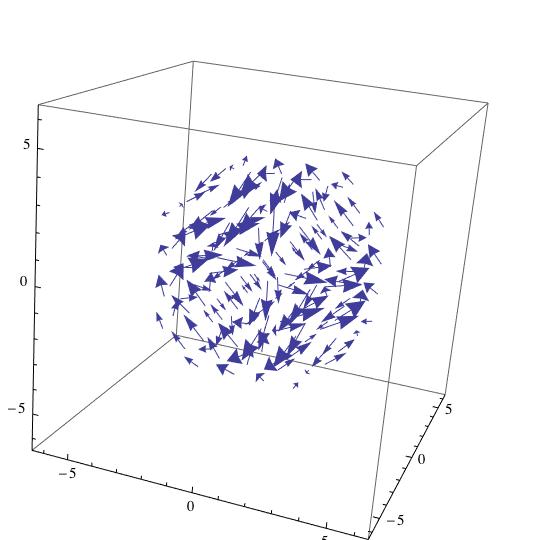
enter image description here

$\endgroup$

1 Answer 1

15
$\begingroup$

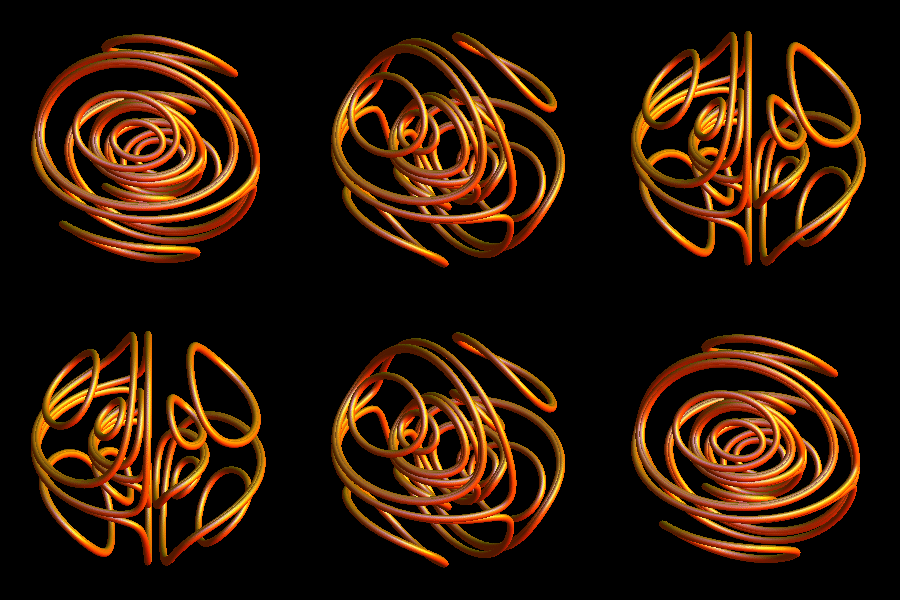
If you want a different 3D visualization, maybe try field lines. Usually, one should be suspicious of field line plots for time-dependent electromagnetic waves (because causality casts doubts on the meaning of plotting a spatially extended field line for a globally fixed time), but there have been recent high-profile papers that show such plots.

Purely as a way to visualize the vectorial patterns, this may be quite useful:

  • First, copy the definitions in this answer.
  • Then, prepare a list of seed points at which the field lines start, together with a length value determining how long the lines will approximately be (chosen here to be 1.25 and .35 for points on two icosahedra at different distance from the origin.
  • Finally, make a list of 3D plots and rasterize them. You could also make a single 3D plot and manipulate it interactively.

However, the large amount of Graphics3D data makes the interactive version very sluggish. That's why I didn't use it below, and instead generate a GIF movie with a viewpoint that rocks back and forth to exhibit the 3D effect better.

Edit

The seedList may contain points at which the vector field is singular, so that NDSolve (which is called in fieldLinePlot) will fail to find a field line. If you get errors because of this, you can always perturb the seed points a little. I am doing that below.

Also, I prefer the old VectorAnalysis package so I used it below. If you have version 9 and prefer the new syntax, replace CoordinatesFromCartesian[{x, y, z}, Spherical] by CoordinateTransform["Cartesian" -> "Spherical", {x, y, z}] in the definition of fp.

Quiet@Needs["VectorAnalysis`"]

seedList = 
  With[{vertices = .1 N[PolyhedronData["Icosahedron"][[1, 1]]]}, 
   Join[Map[{# + .001, 1.25} &, vertices], 
    Map[{#/2 + .001, .35} &, vertices]]];

fp = fieldLinePlot[
   Re[VectorSphericalWaveM[2, 1, 
     Sequence @@ CoordinatesFromCartesian[{x, y, z}, Spherical]]], {x,
     y, z}, seedList, 
   PlotStyle -> {Orange, Specularity[White, 16], Tube[.003]}, 
   PlotRange -> All, Boxed -> False, Axes -> None];

frames = Table[
   Rasterize[
    Show[fp, Background -> Black, 
     ViewVector -> {{2 Cos[a], 2 Sin[a], 1.5}, {0, 0, 0}}, 
     ViewVertical -> {0, 0, 1}, ViewAngle -> .1, 
     ViewCenter -> {{0, 0, 0}, {0.5, 0.5}}], "Image", 
    ImageSize -> 300], {a, Pi/10, Pi/2, Pi/10}];

Export["fieldlines.gif", Join[frames, Reverse[frames]], 
 AnimationRepetitions -> Infinity, "DisplayDurations" -> .15]

fieldlines gif

The speed of the visualization is strongly determined by the number of seed points and the length over which you plot the field lines. One can probably optimize that by trial and error.

$\endgroup$
4
  • $\begingroup$ HI Jens, it doesn't seem to work. I am getting an error. First, I am using Sequence @@ CoordinateTransform["Cartesian" -> "Spherical", {x, y, z}] because I am using version 9. Then I am taking the fieldLinePlot out of the Table because I just want one frame. When I run it, I get a bunch of errors, the first one being NDSolve[...] nether a list of replacement rules nor a valid dispatch table followed by part specification errors. The code runs fine in the two examples that you linked to (pair of charges, and current). Any ideas? $\endgroup$
    – QuantumDot
    Commented May 20, 2013 at 0:52
  • $\begingroup$ You're right, I see this in version 9, too. Not in version 8 - but it suggests that I have to catch some NDSolve failure... hopefully I can fix that soon (maybe not today, though). $\endgroup$
    – Jens
    Commented May 20, 2013 at 2:53
  • $\begingroup$ I've worked around the error message in version 9 by perturbing the initial points for the field lines. I also know what could be changed in the field line plotting function to avoid the error - but I'll make those changes later... hope the example works properly now. $\endgroup$
    – Jens
    Commented May 20, 2013 at 5:24
  • $\begingroup$ It works! Though it's hard to choose the best seed points $\endgroup$
    – QuantumDot
    Commented May 26, 2013 at 5:34

Your Answer

By clicking “Post Your Answer”, you agree to our terms of service and acknowledge you have read our privacy policy.

Not the answer you're looking for? Browse other questions tagged or ask your own question.