6
$\begingroup$

I'm working on a simulation study using Mathematica 8. At the end of the analysis I'll have a matrix of data containing my results (assume for three variables like x,y & z). I used these codes for integrating labels (e.g. x,y & z) into data matrix and creating a table format:

data = Table[Random[], {i, 3}, {j, 3}] (* as an example of data*)
label= {"x","y","z"}
Text@Grid[Insert[data, lab, 1], Frame -> All]

resulting in (I don't know why frames don't appear here but do in Mathematica): \begin{array}{ccc} \text{x} & \text{y} & \text{z} \\ 0.0047326 & 0.877782 & 0.924523 \\ 0.188628 & 0.171809 & 0.317739 \\ 0.775678 & 0.0886559 & 0.336866 \end{array}

I wan to how I can export this table into Ms Word as a table not an equation. Any help and idea is appreciated.

Thanks, Amin.

$\endgroup$
1
  • 1
    $\begingroup$ I'm not sure what the table in MS Word really is, but maybe you can export your data to "Table"/"TSV"/"CSV" formats, then open it in MS Excel and copy-and-paste from there into Word. $\endgroup$
    – Silvia
    Commented May 19, 2013 at 18:46

2 Answers 2

11
$\begingroup$

You can use Word's "Convert Text to Table" function for this.

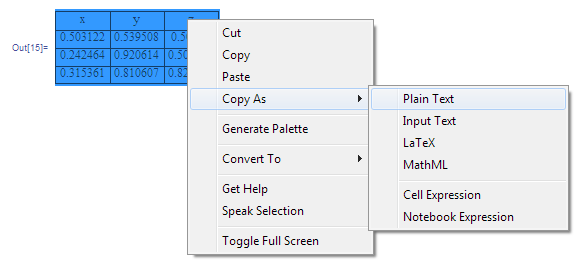
  • Select the grid in Mathematica and copy as plain text.

enter image description here

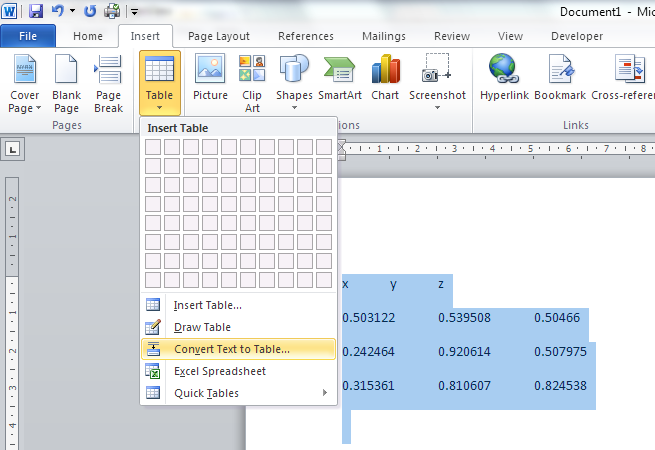
  • Paste it into Word, select it and convert to a table

enter image description here

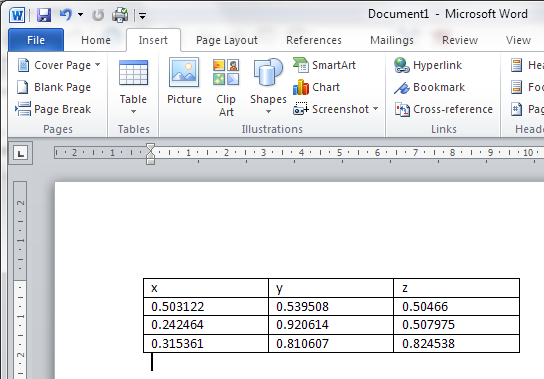
  • You get this:

enter image description here

$\endgroup$
1
  • $\begingroup$ Simon, this works too but when we have a large table as output copy/paste may create typos.Thanks. $\endgroup$
    – Amin
    Commented May 29, 2013 at 15:10
7
$\begingroup$

I recommend you create a List of lists (which is how you represent an array or matrix in Mathematica):

mytable = Prepend[data, label]
(* {{"x", "y", "z"}, {0.15339, 0.622021, 0.932763}, {0.804435, 0.894563, 0.0611165}, {0.786724, 0.980867, 0.766825}} *)

Then Export it to an Excel file:

Export["mytable.xls", mytable]

And then import it into Word, which should be a snap.

If you want to format the table in Mathematica instead of Excel or Word, you can Export it from Mathematica as a graphic like this:

formattedgraphic = Text@Grid[Insert[data, label, 1], Frame -> All, Spacings -> 5, ItemSize -> All]
Export["table.tiff", formattedgraphic, ImageResolution -> 300]
  • ItemSize here helps to avoid spanning characters appearing in the table.

Note that there is great flexibility with Export:

$\endgroup$
2
  • $\begingroup$ Thank you guys. It seems that the only way is to export in Excel format and copy and paste the table into MS Word. $\endgroup$
    – Amin
    Commented May 26, 2013 at 5:00
  • $\begingroup$ Well, with Mathematica there are always many roads that lead to Rome. Perhaps you'd prefer exporting as a graphic (see edited answer). Hope this helps. $\endgroup$ Commented May 26, 2013 at 6:12

Your Answer

By clicking “Post Your Answer”, you agree to our terms of service and acknowledge you have read our privacy policy.

Not the answer you're looking for? Browse other questions tagged or ask your own question.