2
$\begingroup$

I have studied the relational contents through the webpage Placing x-axes label below rather than at end of axes, but not found: (1)How to put annotation on the left of y axis and display the graphic properly without using FrameLabel. I don't use the function FrameLabel because the curve owns value in the positive and negative y axis. I found if using FrameLabel, the x-direction frame will display on the bottom without overlapping x axis. (2)The webpage didn't point out how to adjust the distance between the text generated from FrameLabel and axis. The default distance between FrameLabel text such as text "x-axis" in the following picture and x axis is very far, so it can not be used in paper directly. So I think it necessary to open a new post here.

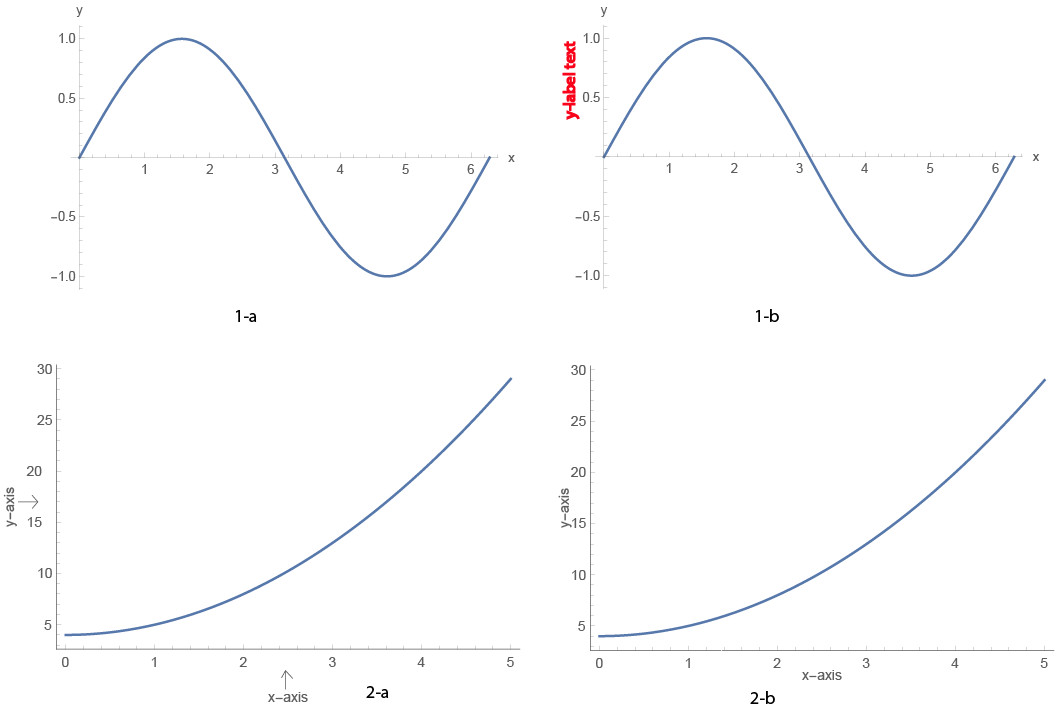
In the first row of the following picture, I want to insert an annotation "y-label text" into fig 1-a and make it become into the fig 1-b; the second, move a little bit of "x-axis" and "y-axis" to their axis in the fig 2-a and make it into the fig 2-b. The codes and pictures as follows. How can I achieve the results? Thank you!

For fig 1-a

Plot[Sin[x], {x, 0, 2 Pi},
 AxesLabel -> {"x", "y"}, PlotRange -> All]

For fig 2-a

Plot[x^2 + 4, {x, 0, 5}, ImageSize -> 500, Axes -> False, 
 Frame -> {{True, False}, {True, False}}, 
 FrameLabel -> {{"y-axis", None}, {"x-axis", None}}, 
 FrameTicks -> All]

and the picture: enter image description here

$\endgroup$
1

1 Answer 1

5
$\begingroup$

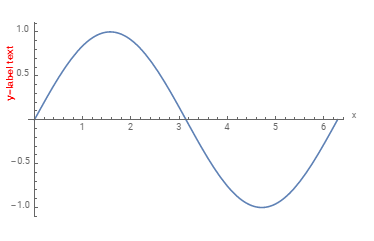
Here is one approach: add the labels in desired places using Epilog (with the option PlotRangeClipping -> False and the option setting for ImagePadding large enough to avoid cropping of the labels):

Plot[Sin[x], {x, 0, 2 Pi}, AxesLabel -> {"x", None}, PlotRange -> All,
  PlotRangeClipping -> False, ImagePadding -> Scaled[.05], 
 Epilog -> Text[Style[Rotate["y-label text", 90 Degree], Red, Bold], {-.5, .5}]]

enter image description here

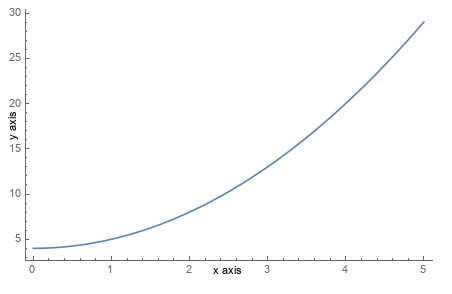
Plot[x^2 + 4, {x, 0, 5}, ImageSize -> 500, Axes -> False, 
  Frame -> {{True, False}, {True, False}}, 
  FrameTicks -> All, 
  PlotRangeClipping -> False,
  ImagePadding -> {{Scaled[.1], Automatic}, {Scaled[.1], Automatic}},
  Epilog -> {Text["y axis", {-.25, 17.5}, {0, 0}, {0, 1}], 
    Text["x axis", {2.5, 1.5}]}]

enter image description here

$\endgroup$
2
  • $\begingroup$ Thank you for hitting the key of the problem. Can you insert a comma at the end of the sentence ImagePadding? In case others may refer to the codes. $\endgroup$
    – likehust
    Commented Jul 11, 2019 at 8:17
  • $\begingroup$ @likehust, thank you. Fixed the missing comma. $\endgroup$
    – kglr
    Commented Jul 11, 2019 at 8:27

Your Answer

By clicking “Post Your Answer”, you agree to our terms of service and acknowledge you have read our privacy policy.

Not the answer you're looking for? Browse other questions tagged or ask your own question.