Could you perhaps explain me the following behaviour? My code is:
sp500 = FinancialData["^SPX", {2007, 1, 1}, Method -> "Legacy"]
This gives me a list that ends with yesterday's value (4,509.37 at 2021-08-27).
But without "Method->Legacy" it shows the last value somewhere in the middle of 2020.
In addition, when I run this:
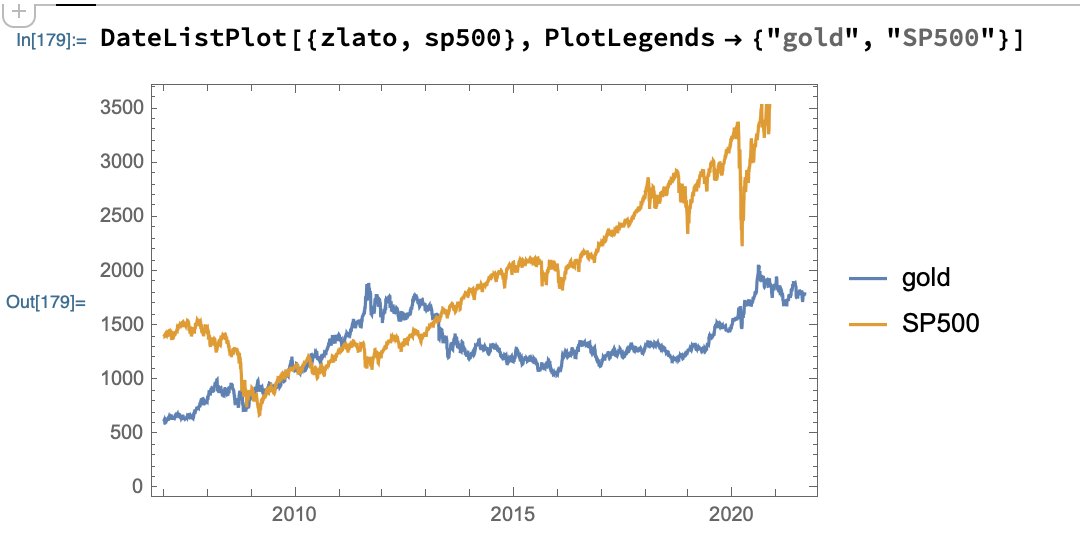
DateListPlot[{zlato, sp500}, PlotLegends -> {"gold", "SP500"}]
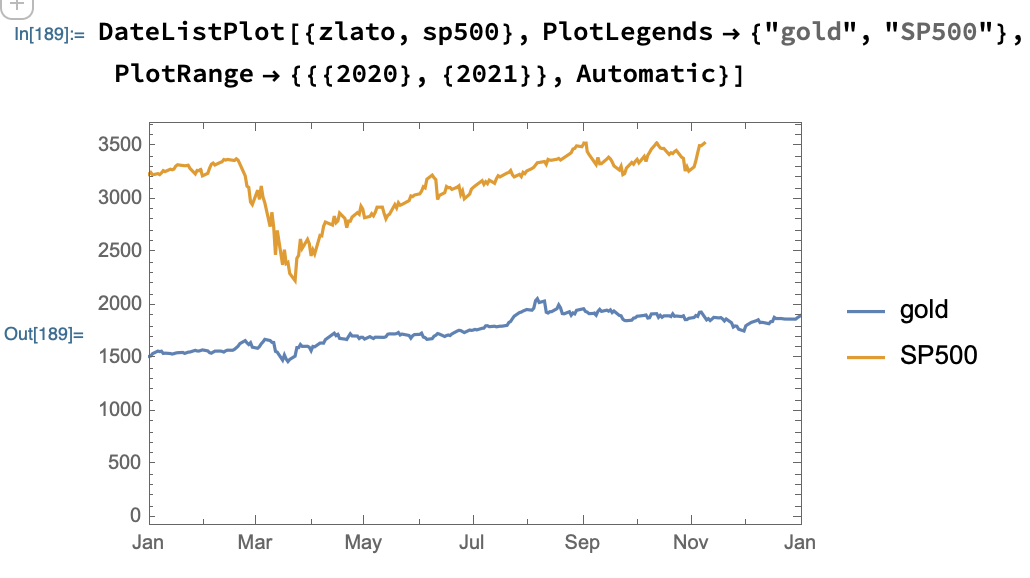
I get a chart where you can see the gold price is up-to-date, but SP500 is not.
Any idea, why would that be?
Thanks,
Jiri
P.S. zlato is gold, is defined as
zlato = FinancialData["XAU/USD", {2007, 1, 1}, Method -> "Legacy"]
With PlotRange limited to 2020-2021, the Plot looks like this:


DateListPlot[sp500]is up to date for me in v12.3.1. Are you sure you aren't just missing a PlotRange option in the DateListPlot ? $\endgroup$zlato = FinancialData["XAU/USD", {2007, 1, 1}, Method -> "Legacy"]$\endgroup$DateListPlot[{zlato, sp500}, PlotLegends -> {"gold", "SP500"}, PlotRange -> {{{2020}, {2021}}, Automatic}]you get a more detailed plot obviously, but still with missing data for SP500. $\endgroup$PlotRange -> Alloption to eachDateListPlot. $\endgroup$