4
$\begingroup$

I have the following series:

f[x_] := Sin[x]
n := 50

Ni3[x_] := Sum[(f[k]*(-1)^k)/((x - k)*Gamma[k + 1]*Gamma[n - k + 1]), {k, 0, n}]/
           Sum[(-1)^k/((x - k)*Gamma[k + 1]*Gamma[n - k + 1]), {k, 0, n}]

Plot[{Ni3[x], f[x]}, {x, -7, 7}, AspectRatio -> Automatic, PlotRange -> 10]

At number of terms n below 40 the plot gives what is expected. But when increasing it above 50 the plot becomes corrupted. The setting $MinPrecision does not affect the result. The series is proven to converge to $f(x)=\sin(x)$.
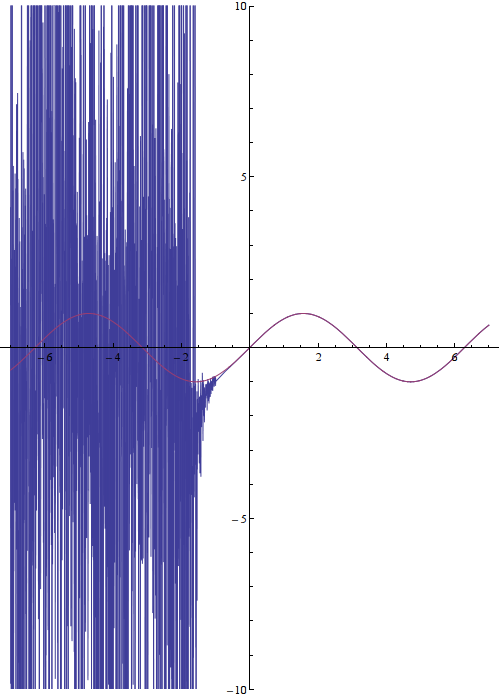
bad plot

$\endgroup$
5
  • 1
    $\begingroup$ Try using a high value of WorkingPrecision in Plot, e.g. WorkingPrecision -> 60. $\endgroup$
    – Szabolcs
    Commented May 7, 2013 at 3:42
  • $\begingroup$ @Szabolcs you made incorrect change to the expression, putting one sum inside the other $\endgroup$
    – Anixx
    Commented May 7, 2013 at 3:44
  • $\begingroup$ @Szabolcs re Working Precision - thanks, it worked. $\endgroup$
    – Anixx
    Commented May 7, 2013 at 3:46
  • $\begingroup$ Sorry about that. When you paste expressions like this, select them, right click, then use Copy As -> Input Form. $\endgroup$
    – Szabolcs
    Commented May 7, 2013 at 3:47
  • $\begingroup$ @Szabolcs I did exactly that. It is what exported as Input Form. $\endgroup$
    – Anixx
    Commented May 7, 2013 at 3:48

1 Answer 1

5
$\begingroup$

As Szabolcs suggests, cranking up WorkingPrecision (or for that matter, just forcing Plot[] to use arbitrary precision) helps a lot. In this answer, I've taken the liberty to slightly simplify your barycentric interpolant as well:

f[x_] := Sin[x]

Ni3[n_Integer, x_] := (x - n) Binomial[x, n]
    Sum[(-1)^(n - k) Binomial[n, k] f[k]/(x - k), {k, 0, n}, Method -> "Procedural"]

Plot[{Ni3[50, x], f[x]}, {x, -7, 7}, AspectRatio -> Automatic, 
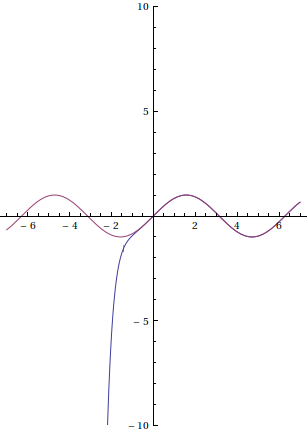
     PlotRange -> 10, WorkingPrecision -> 20]

sine and barycentric interpolant

$\endgroup$
15
  • $\begingroup$ How to force it to use arbitrary precision? $\endgroup$
    – Anixx
    Commented May 7, 2013 at 3:50
  • $\begingroup$ You get this plot with WorkingPrecision -> 20? I get junk with that ... I needed a much higher value. $\endgroup$
    – Szabolcs
    Commented May 7, 2013 at 3:50
  • $\begingroup$ @Szabolcs, well, I simplified OP's function a bit; that helped. $\endgroup$ Commented May 7, 2013 at 3:51
  • $\begingroup$ @Anixx, as I said, with WorkingPrecision. $\endgroup$ Commented May 7, 2013 at 3:52
  • $\begingroup$ To be precise, it runs out of precision around 1.5 for a precision setting of 20, around -1.2 for 30, and looks fine for 40 (for default plot range). $\endgroup$
    – Szabolcs
    Commented May 7, 2013 at 3:52

Not the answer you're looking for? Browse other questions tagged or ask your own question.