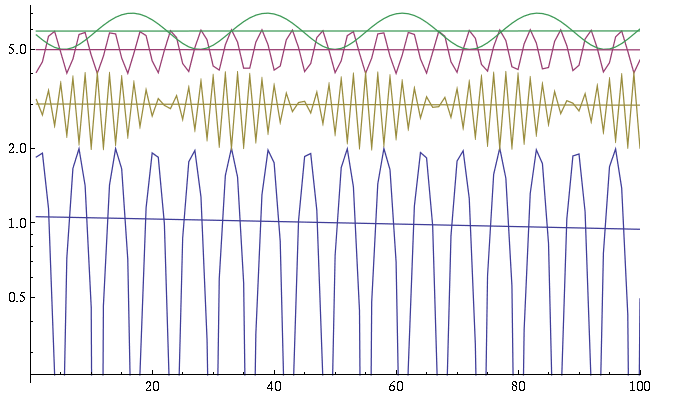
I'm plotting multiple lists with ListPlot[] or ListLogPlot[]:
ListLogPlot[{ListA, ListB, ListC, ListD, ListE}, PlotRange -> {{0, 100}, Automatic}]
I also have fits, $(f_a,f_b,f_c,f_d,f_e)$ for the data in each of the lists. How can I overlay the fits in the same color and for the same $(x,y)$ range?

