What flinty says in his comment is correct: you'll have a hard time fully automating this.
However, we can give it a go for an individual plot and then we'll have a better idea of what's required.
ic = SelectComponents[ColorNegate[MorphologicalBinarize[i, .6]], Large]
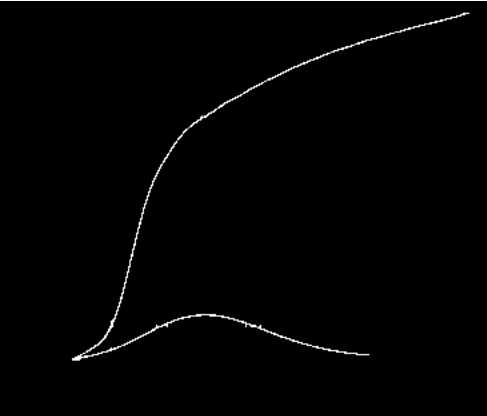
Here we've managed to extract the main solid lines, but it's a bit messy and this isn't going to generalise well.
We can clean up these components a little bit (here's even more tunable parameters that will make this difficult to generalise):
d = Pruning[
  MorphologicalTransform[Thinning@Pruning[ic, 10], "Bridge"], 10]
and now we split them into two, by subtracting the branch points (where the two overlap) from the image:
i2 = d - MorphologicalTransform[d, {"SkeletonBranchPoints"}]
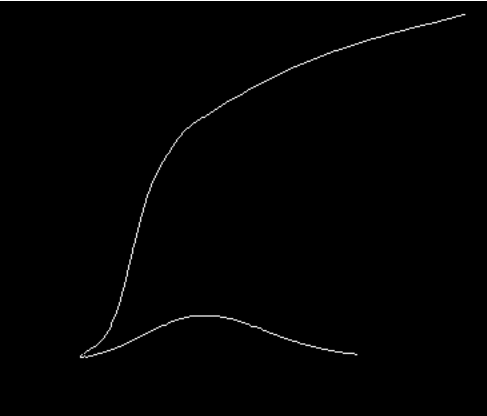
If you look very closely you can see they no longer connect. We can verify this with:
Colorize[MorphologicalComponents[i2]]
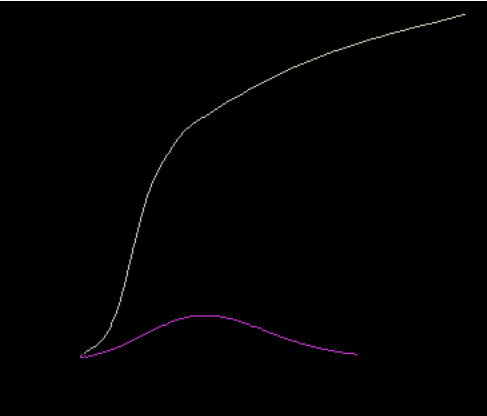
Now that we've gone this far we might as well finish the job.
Let's crop the image and extract the components.
components = MorphologicalComponents[ImageCrop@i2]
(We crop here since we know that the plot goes from 0 to 1 for one of our lines. If that wasn't the case you'd need to figure out how to rescale the data to the correct axes.)
Let's get the individual components out of this Matrix and turn them into black-and-white images where black is the plot:
plots = ColorNegate@Image@# & /@
  Table[(components /. {n -> 1, _Integer -> 0}), {n,
    Union[Flatten@components][[2 ;;]]}]
And now we can use that handy resource function to extract the values:
ListLinePlot[ResourceFunction["ExtractPlotImageData"] /@ plots]
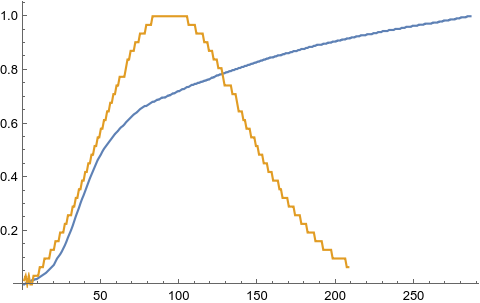
Snatching defeat from the jaws of victory, our resource function automatically scales the y axis. We'll now need to implement our own version that keeps the y scale...
pd = Table[(components /. {n -> 1, _Integer -> 0}), {n,
   Union[Flatten@components][[2 ;;]]}]

rescaled =
  SubsetMap[Rescale[#, {0, Dimensions[pd][[3]]}] &,
     SubsetMap[Rescale[#, {0, Dimensions[pd][[2]]}] &,
      Position[Transpose@Reverse@#, 1], {All, 2}], {All, 1}] & /@ pd;
This is a pretty naive version of that ExtractPlotImageData function and (I'm sure) fails many edge cases.
Anyway, now we've got our plot redrawn!
ListLinePlot@rescaled
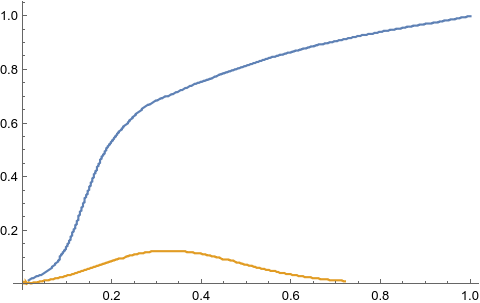
And even overlay our one and the original:
Overlay[{
  Show[i, ImagePadding -> {{0, 0}, {0, 6}}],
  ListLinePlot[rescaled, AspectRatio -> .92,
   ImagePadding -> {{50, 8}, {0, 0}}]
  }, PlotRangeClipping -> False]
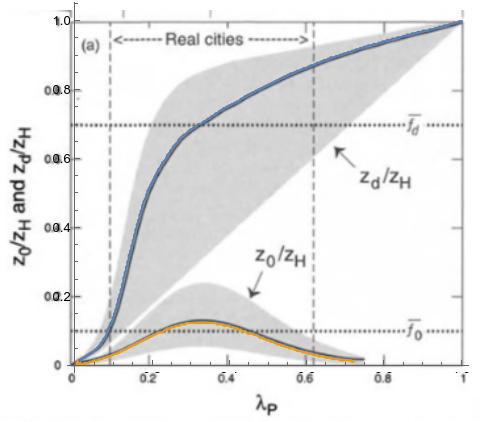
I hope it's clear that this kind of process is quite hard to automate, although with a few hours of work you might come up with a Manipulate that does much of what you need with some manual intervention (picking the scale of the lines, picking the threshold for the binarize, and so on).

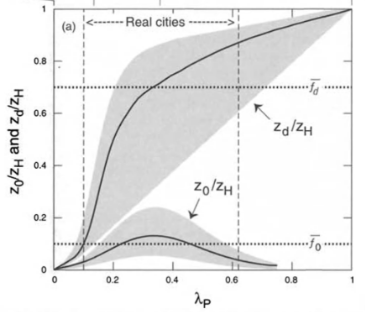


cropped = ImageTake[img, {10, 270}, {55, 352}];then put this into an image editing program and erase as much as possible of the lines you don't want. $\endgroup$