MMA 12.1 For quite some time I have been chasing a bug that I could trace down to the following code. As it is not impossible to fool oneself, I would be glad if somebody could verify this before I report it to Wolfram:
I have a well behaved InterpolatingFunction fun1:
fun1[z_] =
   InterpolatingFunction[{{-5., 0.}}, {5, 3, 0, {46}, {4}, 0, 0, 0, 0,
       Automatic, {}, {},
      False}, {{-5., -4.79167, -4.58333, -4.375, -4.16667, -3.95833, \
-3.75, -3.54167, -3.33333, -3.125, -2.91667, -2.70833, -2.5, \
-2.39583, -2.29167, -2.1875, -2.08333, -1.97917, -1.875, -1.77083, \
-1.66667, -1.5625, -1.45833, -1.35417, -1.25, -1.14583, -1.04167, \
-0.9375, -0.885417, -0.833333, -0.78125, -0.729167, -0.677083, \
-0.625, -0.572917, -0.520833, -0.46875, -0.416667, -0.364583, \
-0.3125, -0.260417, -0.208333, -0.15625, -0.104167, -0.0520833,
       0.}}, {{2.85192}, {2.67974}, {2.50886}, {2.3394}, {2.17145}, \
{2.00516}, {1.84064}, {1.67807}, {1.51763}, {1.35951}, {1.20397}, \
{1.05127}, {0.901755}, {0.828303}, {0.755796}, {0.684292}, \
{0.613859}, {0.544567}, {0.476499}, {0.409743}, {0.344399}, \
{0.280578}, {0.218405}, {0.158022}, {0.0995881}, {0.043287}, \
{-0.0106712}, {-0.0620432}, {-0.0866725}, {-0.110545}, {-0.133618}, \
{-0.155844}, {-0.177172}, {-0.197544}, {-0.216899}, {-0.235169}, \
{-0.252278}, {-0.268143}, {-0.282669}, {-0.295752}, {-0.307275}, \
{-0.317105}, {-0.325091}, {-0.331059}, {-0.334812}, {-0.336118}}, \
{Automatic}][z]


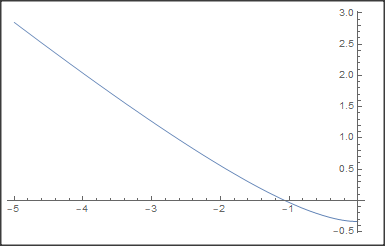
Plot[fun1[z], {z, -5, 0}]
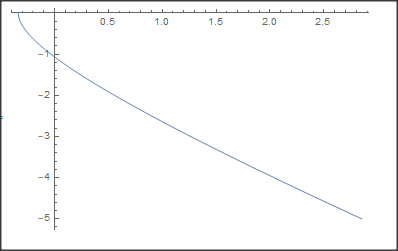
If I take the inverse function, you would expect a plot of the following form (obtained numerically):
d1 = Table[{x, fun1[x]}, {x, -5, 0, .1}];
ListLinePlot[Reverse /@ d1]
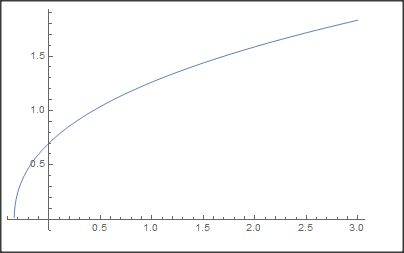
However, what I get is:
Plot[InverseFunction[fun1][z], {z, -.336, 3}]


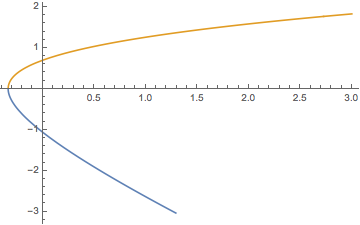
Plot[{fun1[z], InverseFunction[fun1][z], z}, {z, -.336, 3}, AspectRatio -> 1, PlotRange -> {{0, 3}, {0, 3}}]- it's symmetrical, so the inverse is correct over this domain, but not where you want it. $\endgroup$