3
$\begingroup$

I have this function that creates a plot in Wolfram Mathematica: ListPolarPlot[{98.00000, 93.99300, 83.60000, 67.50000, 48.72000, 30.34000, 15.75000, 5.06000, 0.96000, 0.00000, 1.23000, 6.05000, 17.25000, 33.21000, 51.62000, 70.50000, 85.36000, 95.93100, 99.50000, 94.96200, 85.36000, 69.00000, 49.30000, 30.75000, 15.50000, 5.06000, 0.93000, 0.00000, 1.20000, 5.61000, 17.75000, 32.80000, 51.04000, 69.75000, 85.36000, 94.96200, 99.00000}, Joined -> True]

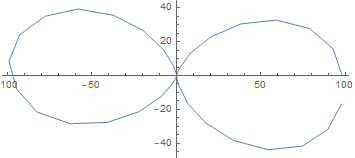
What I want to do, is to connect the first and the last point on the graph. Is there a way to do it via this function? I've searched for it, but didn't find a thing to be honest.

There is a screenshot of the result that I have now:

enter image description here

$\endgroup$

1 Answer 1

3
$\begingroup$

Try this: here is your list:

lst = {98.00000, 93.99300, 83.60000, 67.50000, 48.72000, 30.34000, 
   15.75000, 5.06000, 0.96000, 0.00000, 1.23000, 6.05000, 17.25000, 
   33.21000, 51.62000, 70.50000, 85.36000, 95.93100, 99.50000, 
   94.96200, 85.36000, 69.00000, 49.30000, 30.75000, 15.50000, 
   5.06000, 0.93000, 0.00000, 1.20000, 5.61000, 17.75000, 32.80000, 
   51.04000, 69.75000, 85.36000, 94.96200, 99.00000};

Let us do the following:

lst1 = Join[lst, {First[lst]}];
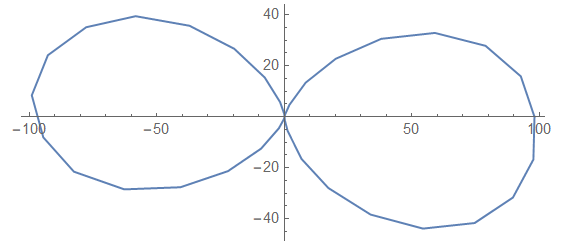
ListPolarPlot[lst1, Joined -> True, DataRange -> {0, 2 \[Pi]}]

yielding

enter image description here

Have fun!

$\endgroup$

Your Answer

By clicking “Post Your Answer”, you agree to our terms of service and acknowledge you have read our privacy policy.

Not the answer you're looking for? Browse other questions tagged or ask your own question.