I'm solving the following equation, which should be straightforward:
func1[A1_, A2_] := -((
   4 I + 4 I A2^2 - 12 I A1 (1 + A2 ((2 - I) + A2 - 2 I eig)) +
    A2 ((1 + 2 I) + 2 eig) ((5 + 4 I) + 4 eig ((1 + 2 I) + eig)))/(
   8 A2));
sol1[A1_, A2_] := Solve[func1[A1, A2] == 0, eig];
I want to extract the analytic solution to this, but I'm not sure that what Mathematica is producing is correct. Here are the plots to explain what I mean:
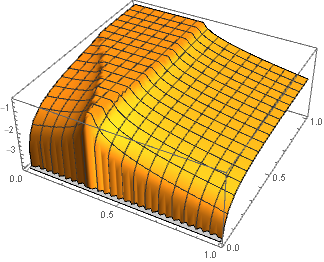
This is a smooth plot and something that I expect. I'm plotting this with the line:
Plot3D[Re[eig /. sol1[A1, A2][[1]]], {A1, 0, 1}, {A2, 0, 1}]
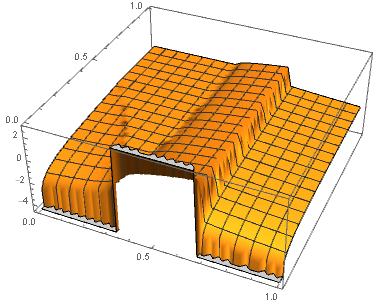
Now if I try to get the analytic expression for this solution and I plot it, I get something different. I can demonstrate this just by changing my Plot3D command:
Plot3D[Evaluate[Re[eig /. sol1[A1, A2][[1]]]], {A1, 0, 1}, {A2, 0, 1}]
produces:
As you can see, the plot is different; it's jagged with a discontinuity. With this, I can't be sure that the analytic solution I extract from Mathematica is right. I'd like to either replicate the first plot with an explicit expression that I can acquire somehow or find out what function exactly Mathematica is plotting in the first instance. Am I missing something in regard to rule solutions here?
Thanks


N[Solve[x^3 + a*x + 1 == 0, x] /. a -> I]which results in{{x -> 0.780156 - 1.03569 I}, {x -> -1.0047 + 0.345379 I}, {x -> 0.224543 + 0.690315 I}}andN[Solve[x^3 + a*x + 1 == 0 /. a -> I, x]]which produces{{x -> -1.0047 + 0.345379 I}, {x -> 0.224543 + 0.690315 I}, {x -> 0.780156 - 1.03569 I}}. As we see, the order of the roots in both outputs is different. $\endgroup$