2
$\begingroup$

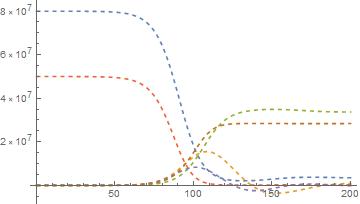
I am trying to create and solve a coupled delayed SIR model in Mathematica. I am getting negative points in my plot which doesn't make sense. Need help to figure out what am I doing wrong. My code is

SS4 = NDSolve[{x1'[t] == - x1[t] ((0.3/(80*10^6)) y1[t] + (0.5/(80*10^6)) y2[t]), x2'[t] == - x2[t] ((0.5/(80*10^6)) y1[t] + (0.5/(50*10^6)) y2[t]), y1'[t] == x1[t] ((0.3/(80*10^6)) y1[t - 14] + (0.5/(80*10^6)) y2[
      t - 14]) - (1/16) y1[t - 14], y2'[t] == 
x2[t] ((0.5/(80*10^6)) y1[t - 14] + (0.5/(50*10^6)) y2[
      t - 14]) - (1/16) y2[t - 14], z1'[t] == (0.3/(80*10^6)) x1[t - 14] y1[t - 14],z2'[t] == (0.5/(50*10^6)) x2[t - 14] y2[t - 14],  x1[0] == 80*10^6, y1[0] == 150, y1[t /; t <= 0] == E^t, z1[0] == 0,
x2[0] == 50*10^6, y2[t /; t <= 0] == E^t, y2[0] == 100,  z2[0] == 0  }, {x1, y1, z1, x2, y2, z2}, {t, 0, 200}] 

After plotting the solutions I am getting

pp4 = Plot[{x1[t] /. SS4, y1[t] /. SS4, z1[t] /. SS4, x2[t] /. SS4, y2[t] /. SS4, z2[t] /. SS4}, {t, 0, 200}, PlotRange -> All, PlotStyle -> Dashed, PlotLegends -> {"Susecptible", "Active", "Recovery"}]

enter image description here

Obviously the plot shouldn't go negative as it is going. What am I doing wrong?

$\endgroup$

1 Answer 1

4
$\begingroup$

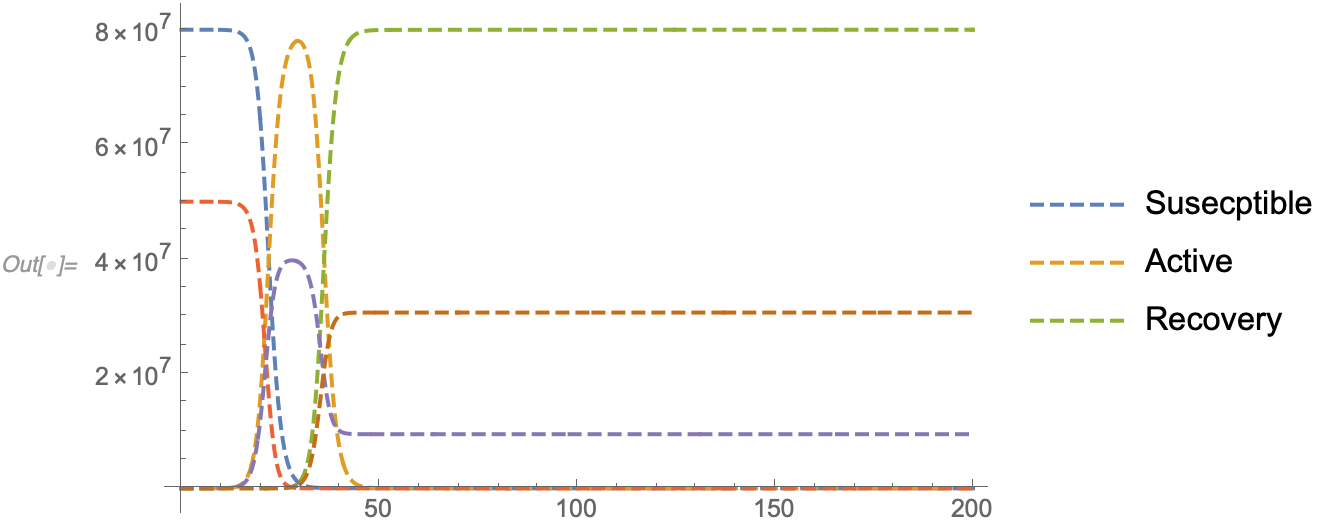
Do you have a source for the equations? I think there is a mistake in how they're set up. As written, conservation of mass is violated, which can lead to the negative values. If you intend there to be a fixed 14-day duration in the infected stages y1 and y2, then try something like:

SS4 = NDSolve[{
  x1'[t] == -x1[t] (0.3/(80*10^6) y1[t] + 0.5/(80*10^6) y2[t]), 
  x2'[t] == -x2[t] (0.5/(80*10^6) y1[t] + 0.5/(50*10^6) y2[t]), 
  y1'[t] == x1[t] (0.3/(80*10^6) y1[t] + 0.5/(80*10^6) y2[t]) - 
     x1[t - 14] (0.3/(80*10^6) y1[t - 14] + 0.5/(80*10^6) y2[t - 14]),
  y2'[t] == x2[t] (0.5/(80*10^6) y1[t] + 0.5/(80*10^6) y2[t]) - 
     x2[t - 14] (0.5/(80*10^6) y1[t - 14] + 0.5/(80*10^6) y2[t - 14]),
  z1'[t] == x1[t - 14] (0.3/(80*10^6) y1[t - 14] + 0.5/(80*10^6) y2[t - 14]),
  z2'[t] == x2[t - 14] (0.5/(80*10^6) y1[t - 14] + 0.5/(80*10^6) y2[t - 14]),
  x1[0] == 80*10^6, y1[0] == 150, y1[t /; t <= 0] == E^t, z1[0] == 0,
  x2[0] == 50*10^6, y2[t /; t <= 0] == E^t, y2[0] == 100, z2[0] == 0},
  {x1, y1, z1, x2, y2, z2}, {t, 0, 200}];

pp4 = Plot[Evaluate[{x1[t], y1[t], z1[t], x2[t] . y2[t], z2[t]} /. SS4],
  {t, 0, 200}, PlotRange -> All, PlotStyle -> Dashed, PlotLegends -> {"Susecptible", "Active", "Recovery"}]

enter image description here

Basically, the outflow from the infected pool should match the inflow 14 days ago (if there was mortality, you'd have to discount for survivorship).

As a side note, you might want to define some constants instead of re-typing the same numbers in your equations!

$\endgroup$
1
  • $\begingroup$ ah yes, makes sense. thank you $\endgroup$ Commented Mar 21, 2021 at 13:39

Your Answer

By clicking “Post Your Answer”, you agree to our terms of service and acknowledge you have read our privacy policy.

Not the answer you're looking for? Browse other questions tagged or ask your own question.