5
$\begingroup$

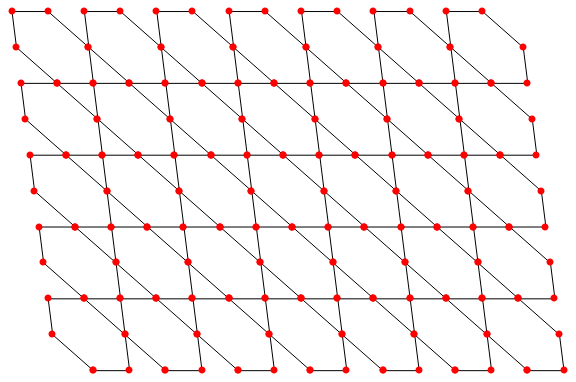
Is it possible to plot the following graph with Mathematica (with red points on all vertices)?

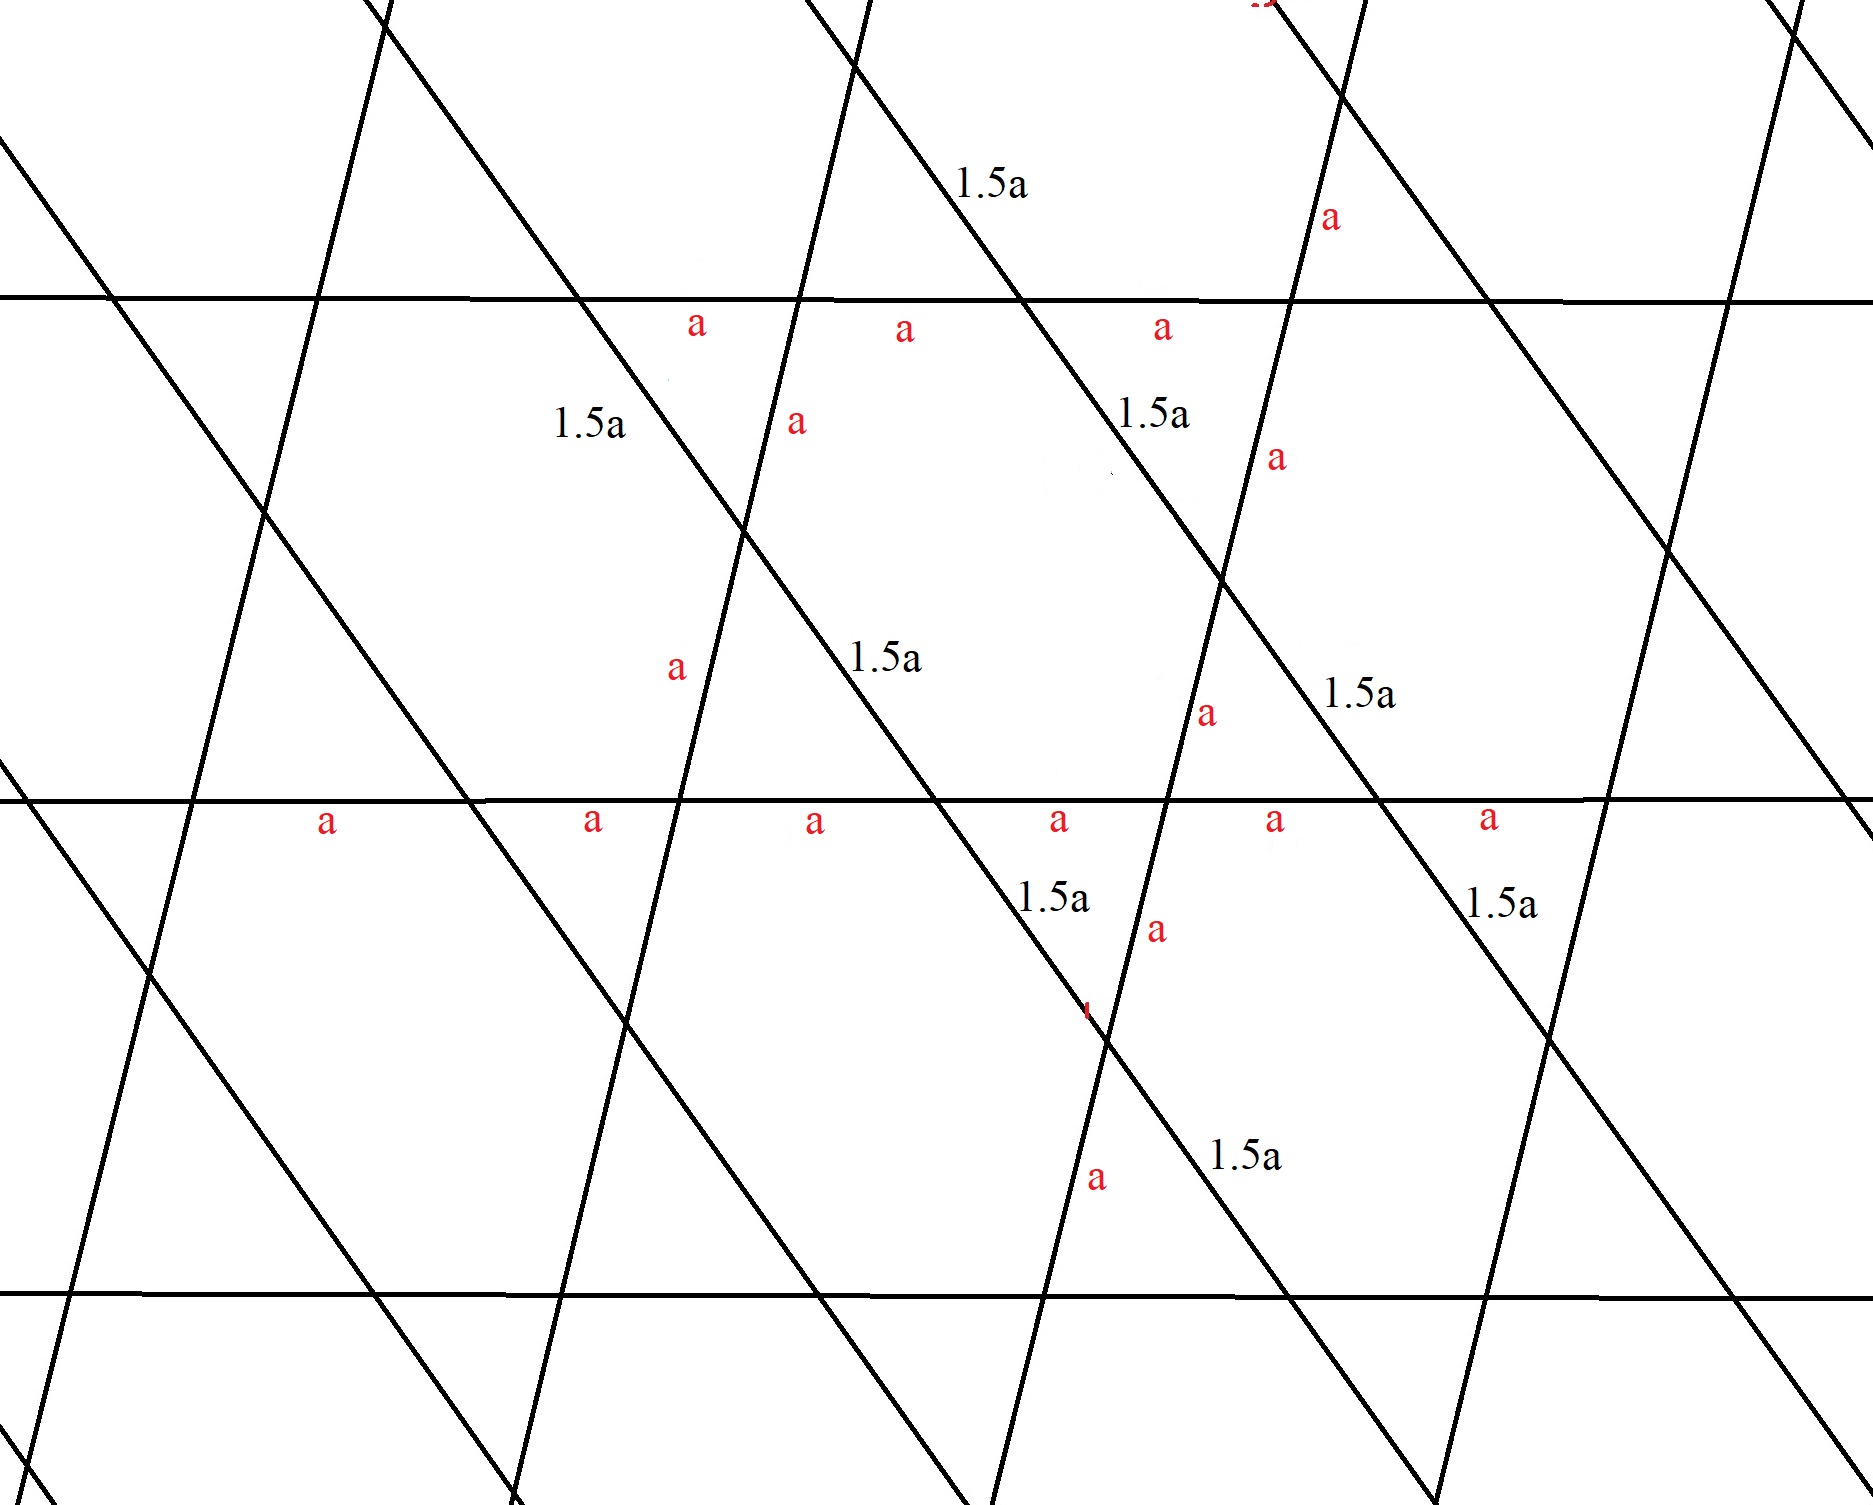
Since I have drawn the plot manually, it is not very clear, but the lengths of the edges are as follows as I have written in the picture:

All the edges on the horizontal lines are of length $a$.

All the edges on the lines which are sloping up (from left to right) are of length $a$.

All the edges on the lines which are sloping down (from left to right) are of length $1.5a$.

Thanks in advance for any comments or hints.

enter image description here

$\endgroup$
2
  • 2
    $\begingroup$ Are you sure that all edges marked a are really the same length? Visually that does not look to be the case in your drawing. $\endgroup$
    – MarcoB
    Commented Jan 22, 2021 at 21:42
  • $\begingroup$ @MarcoB You are right, since I have just drawn it manually by editing programs, I could not draw it in a better shape, that's why I have written the parameter in the picture. Then, is it possible to do that? $\endgroup$
    – Phys96
    Commented Jan 22, 2021 at 23:40

2 Answers 2

7
$\begingroup$

Edit

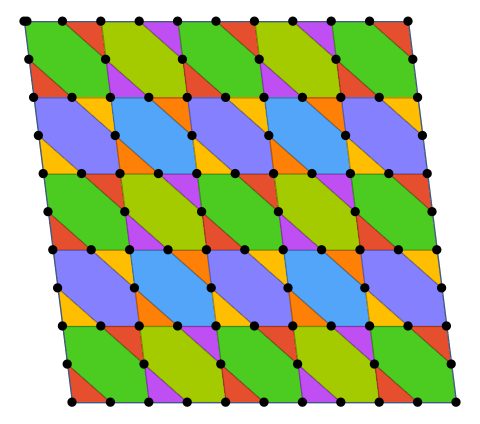
Another effect by use ParametricPlot

a = 1;
{p1, p2, p3} = SSSTriangle[3/2 a, a, a][[1]];
e1 = p2 - p1;
e2 = p3 - p1;
fig = ParametricPlot[{u, v} . {e1, e2}, {u, 0, 10}, {v, 0, 10}, 
   MeshFunctions -> {#3 &, #4 &, #3 + #4 - 1 &}, 
   Mesh -> {Range[0, 20, 2]}, PlotPoints -> 80, Axes -> False, 
   Frame -> False, 
   MeshShading -> 
    ArrayReshape[ColorData[114, "ColorList"], {2, 2, 2}]];
pts = ParametricPlot[{u, v} . {e1, e2}, {u, 0, 10}, {v, 0, 10}, 
    MeshFunctions -> {#3 &, #4 &, #3 + #4 - 1 &}, 
    Mesh -> {Range[0, 20, 2]}, PlotStyle -> None, Axes -> False, 
    Frame -> False, BoundaryStyle -> None, PlotPoints -> 100] // 
   Graphics`Mesh`FindIntersections;
Show[fig, Graphics[{PointSize[Large], Black, Point[pts]}]]

enter image description here

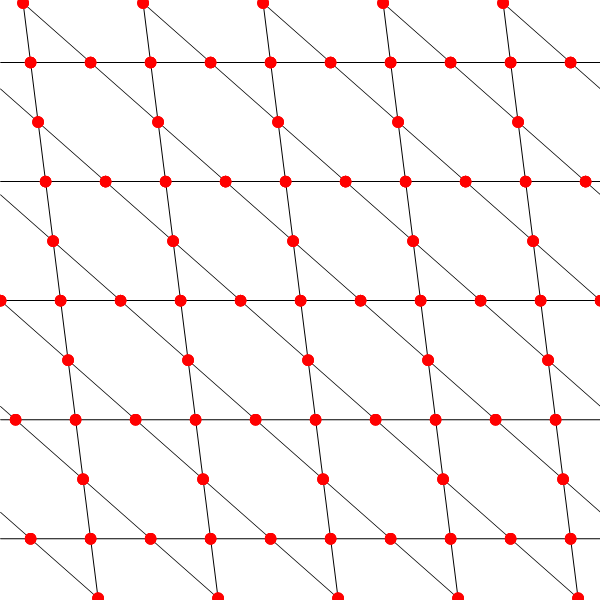
Updated

a = 1;
SSSTriangle[3/2 a, a, a];
{p1, p2, p3} = %[[1]];
lines1 = Table[
   TranslationTransform[i*2 (p2 - p1)][
    InfiniteLine[{p1, p3}]], {i, -5, 5}];
lines2 = Table[
   TranslationTransform[i*2 (p3 - p1)][
    InfiniteLine[{p1, p2}]], {i, -5, 5}];
lines3 = Table[
   TranslationTransform[i*2 (p2 - p1)][
    InfiniteLine[{p2, p3}]], {i, -5, 5}];
points1 = Outer[RegionIntersection[{#1, #2}] &, lines1, lines2];
points2 = Outer[RegionIntersection[{#1, #2}] &, lines2, lines3];
points3 = Outer[RegionIntersection[{#1, #2}] &, lines3, lines1];
Graphics[{lines1, lines2, lines3, Red, PointSize[Large], points1, 
  points2, points3}, PlotRange -> 5]

enter image description here

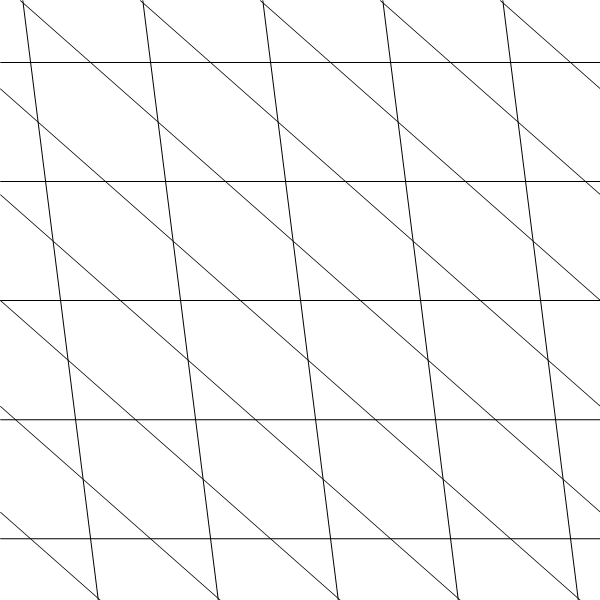
Original

a = 1;
SSSTriangle[3/2 a, a, a];
{p1, p2, p3} = %[[1]]
Graphics[{Table[
   TranslationTransform[i*2 (p2 - p1)][
    InfiniteLine[{p1, p3}]], {i, -5, 5}], 
  Table[TranslationTransform[i*2 (p3 - p1)][
    InfiniteLine[{p1, p2}]], {i, -5, 5}], 
  Table[TranslationTransform[i*2 (p2 - p1)][
    InfiniteLine[{p2, p3}]], {i, -5, 5}]}, PlotRange -> 5]

enter image description here

$\endgroup$
5
  • $\begingroup$ Thank you very much. I really appreciate your time. And how can we put red points on all vertices? $\endgroup$
    – Phys96
    Commented Jan 23, 2021 at 2:01
  • 1
    $\begingroup$ @Phys96 See the updated. $\endgroup$
    – cvgmt
    Commented Jan 23, 2021 at 2:07
  • $\begingroup$ Thanks again. I want to ask about another graph which is a little different from this one. Actually, I tried to learn something from your code to plot it but I could not. May I ask it here, or as a new question? $\endgroup$
    – Phys96
    Commented Jan 23, 2021 at 2:39
  • 1
    $\begingroup$ @Phys96 Ask a new question and link to this answer maybe the better way. $\endgroup$
    – cvgmt
    Commented Jan 23, 2021 at 2:42
  • 1
    $\begingroup$ a = 1; {p1, p2, p3} = SSSTriangle[3/2 a, a, a][[1]]; e1 = p2 - p1; e2 = p3 - p1; ParametricPlot[{u, v} . {e1, e2}, {u, 0, 10}, {v, 0, 10}, MeshFunctions -> {#3 &, #4 &, #3 + #4 &}, Mesh -> {Range[0, 10, 2], Range[0, 10, 2], Range[1, 40, 2]}, PlotPoints -> 50, Axes -> False, Frame -> False, MeshShading -> {{{Red, Green}, {Blue, Yellow}}, {{Brown, Black}, {Cyan, Magenta}}}] $\endgroup$
    – cvgmt
    Commented Jan 24, 2021 at 7:43
5
$\begingroup$

Update: We can generalize the method in the original answer to make the side length a parameter:

ClearAll[angleList, anglePath, hexaGon, hexTile]

angleList[α_] := TriangleMeasurement[SSSTriangle[α, 1, 1], {"InteriorAngle", All}] 

angleList[α]
{ArcCos[1 - α^2/2], ArcCos[Sqrt[α^2]/2],  ArcCos[Sqrt[α^2]/2]}  
anglePath[α_] := FullSimplify @ AnglePath[Prepend[{1, 0}] @
     PadRight[Thread[{{1, α, 1}, angleList[α]}], 5, "Periodic"]]

hexaGon[α_] := {Black, Line[anglePath[α]], Red, PointSize @ Large, Point @ anglePath[α]}

Examples:

Row[{Graphics[hexaGon[1], ImageSize -> 1 -> 100, PlotLabel -> Style["α = 1", 16]], 
  Graphics[hexaGon[3/2], ImageSize -> 1 -> 100, PlotLabel -> Style["α = 3/2", 16]], 
  Graphics[hexaGon[5/4], ImageSize -> 1 -> 100, PlotLabel -> Style["α = 5/4", 16]], 
  Graphics[hexaGon[2/3], ImageSize -> 1 -> 100, PlotLabel -> Style["α = 2/3", 16]]},
     Spacer[20]]

enter image description here

hexTile[α_, nc_, nr_, opts : OptionsPattern[]] := 
 Module[{tr = Subtract @@ anglePath[α][[{1, 4}]]}, 
  Graphics[Table[Translate[hexaGon[α], 
     {2 i - j First[tr], -j Last[tr]}], {i, nc}, {j, 0, nr - 1}],
   opts, ImageSize -> Large]]

Examples:

hexTile[1, 7, 5]
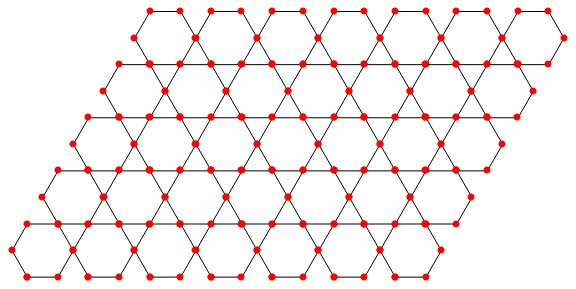
enter image description here

hexTile[3/2, 7, 5]

enter image description here

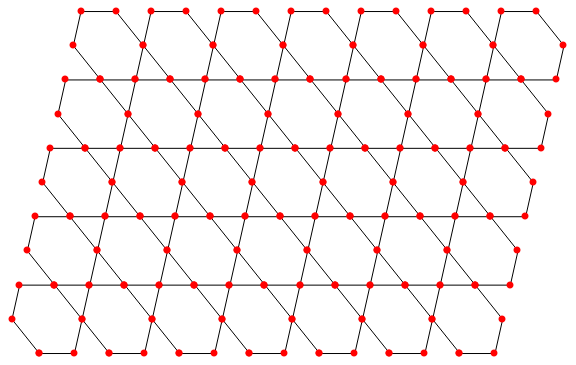
hexTile[5/4, 7, 5]

enter image description here

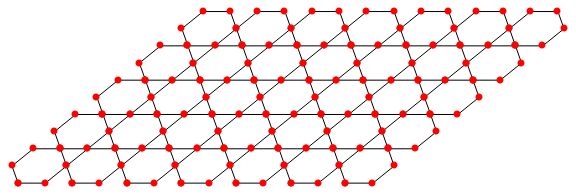
hexTile[2/3, 7, 5]

enter image description here

Original answer:

angles = TriangleMeasurement[SSSTriangle[3/2, 1, 1], {"InteriorAngle", All}] 
{ArcCos[-(1/8)], ArcCos[3/4], ArcCos[3/4]}  

We can use angles and desired lengths (1, 3/2 and 1) with AnglePath to get the coordinates of desired hexagon primitive:

anglepath = FullSimplify @ AnglePath[Prepend[{1, 0}] @
        PadRight[Thread[{{1, 3/2, 1}, angles}], 5, "Periodic"]];

hex = {Line @ anglepath, Red, PointSize @ Large, Point @ anglepath};

Graphics[hex]
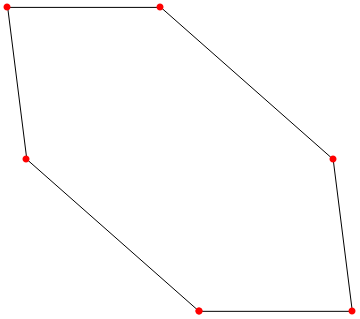
enter image description here

We get the desired picture using translations of hex:

Graphics[Table[Translate[hex, {2 i - j/4, j  3 Sqrt[7]/4}], {i, 5}, {j, 0, 5}]] 
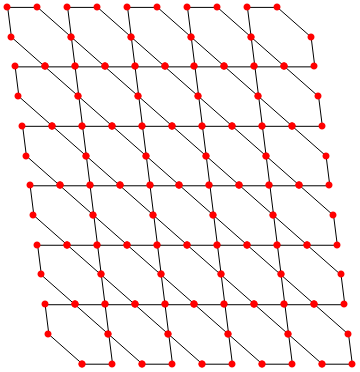
enter image description here

Graphics[Table[Translate[hex, {2 i - j/4, j  3 Sqrt[7]/4}], {i, 10}, {j, 0, 4}], 
 ImageSize -> Large] 
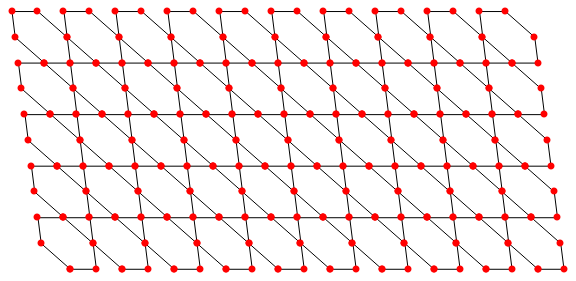
enter image description here

$\endgroup$

Your Answer

By clicking “Post Your Answer”, you agree to our terms of service and acknowledge you have read our privacy policy.

Not the answer you're looking for? Browse other questions tagged or ask your own question.