4
$\begingroup$

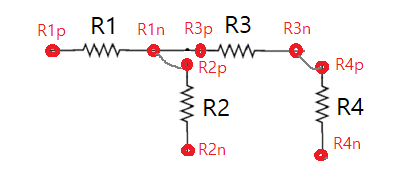
I'm trying to create a graph like this automatically with edges given and need some help. The graph doesn't need to be exactly same but I would like to make some constraints for the generated graph.
This is an example of edges of an electrical graph. And all the graphs have at most two voltage sources V1, V2 and some components may exist or not.

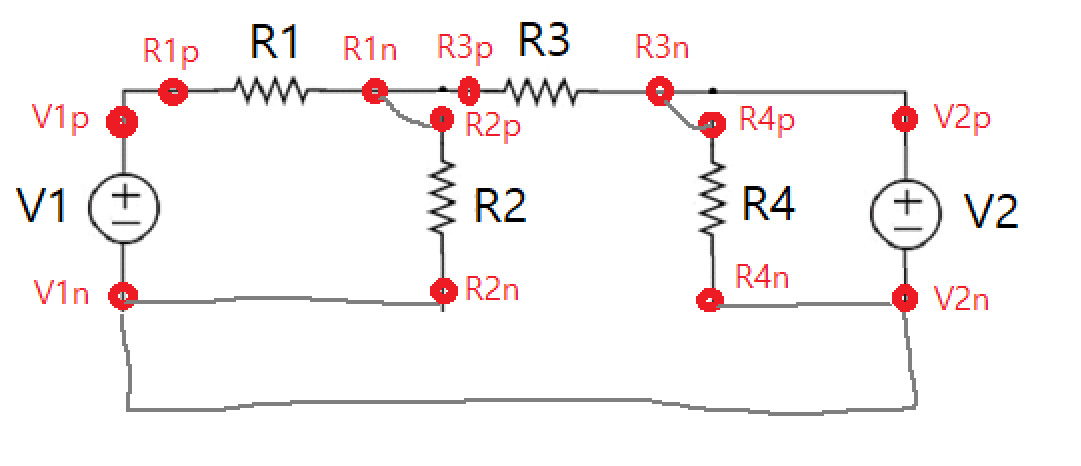
edges = {V1n <-> V2n, V1p <-> R1p, R1n <-> R3p, R1n <-> R2p, 
   R3n <-> R4p, R3n <-> V2p, R4n <-> V2n, R2n <-> V1n};

enter image description here

The graph above is usually drawn like below as an electrical circuit but the style is complicated so it's not necessary to make it as below.

enter image description here

Here are some constraints:

  1. If voltage source V1 or V2 exists then V1 and V2 should be drawn vertically on the left and right as in the figure.
  2. Other vertices other than V1p, V1n, V2p, V2n should be drawn in the region between V1 and V2 as an example image.
  3. Vertices associated the same components {V1p, V1n}, {V2p,V2n}, {R1p, R1n}, {R2p, R2n}, {R3p, R3n}, {R4p, R4n} should be placed next to each other. It would be nice if the edge length between vertices in each pair above are same as well (just to make the symbols same size and look nicer- so it's not required if it's complicated).

Here are some examples of expected graph (or something similar, no need to be exactly same) from given edges:

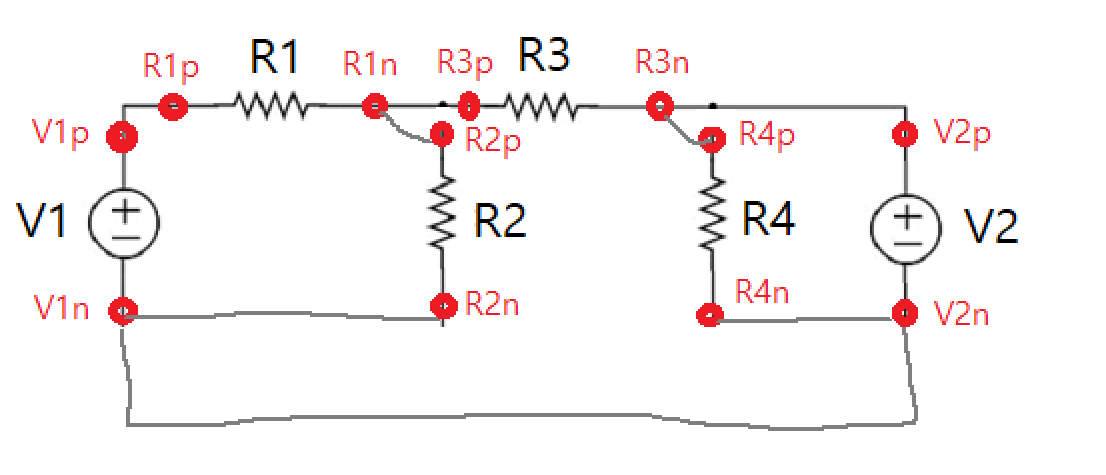
edges = {V1n <-> V2n, V1p <-> R1p, R1n <-> R3p, R1n <-> R2p, 
   R3n <-> R4p, R3n <-> V2p, R4n <-> V2n, R2n <-> V2n};

enter image description here

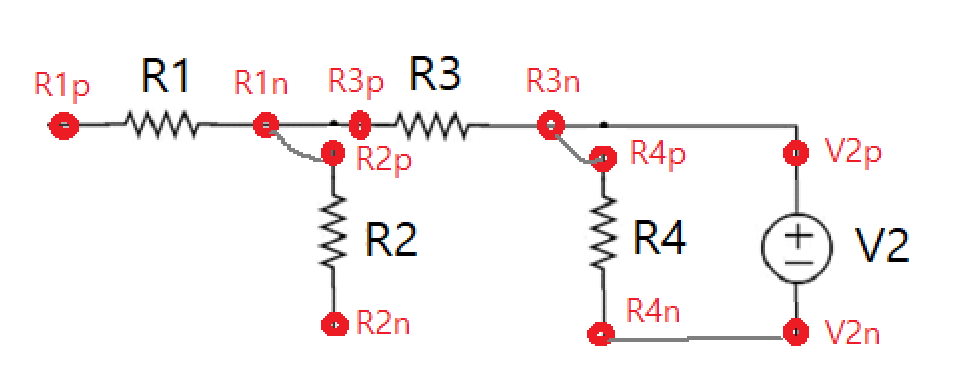
Graph with V1 removed:

edges1 = {R1n <-> R3p, R1n <-> R2p, R3n <-> R4p,  R3n <-> V2p, R4n <-> V2n};

enter image description here

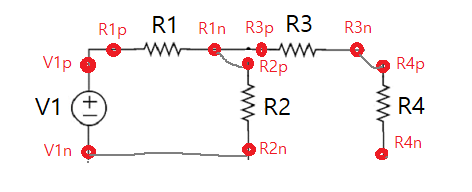
Graph with V2 removed:

edges2= {V1p <-> R1p, R1n <-> R3p, R1n <-> R2p, R3n <-> R4p};
   

enter image description here

Graph with both V1 and V2 removed:

edges3= {R1n <-> R3p, R1n <-> R2p, R3n <-> R4p};
   

enter image description here

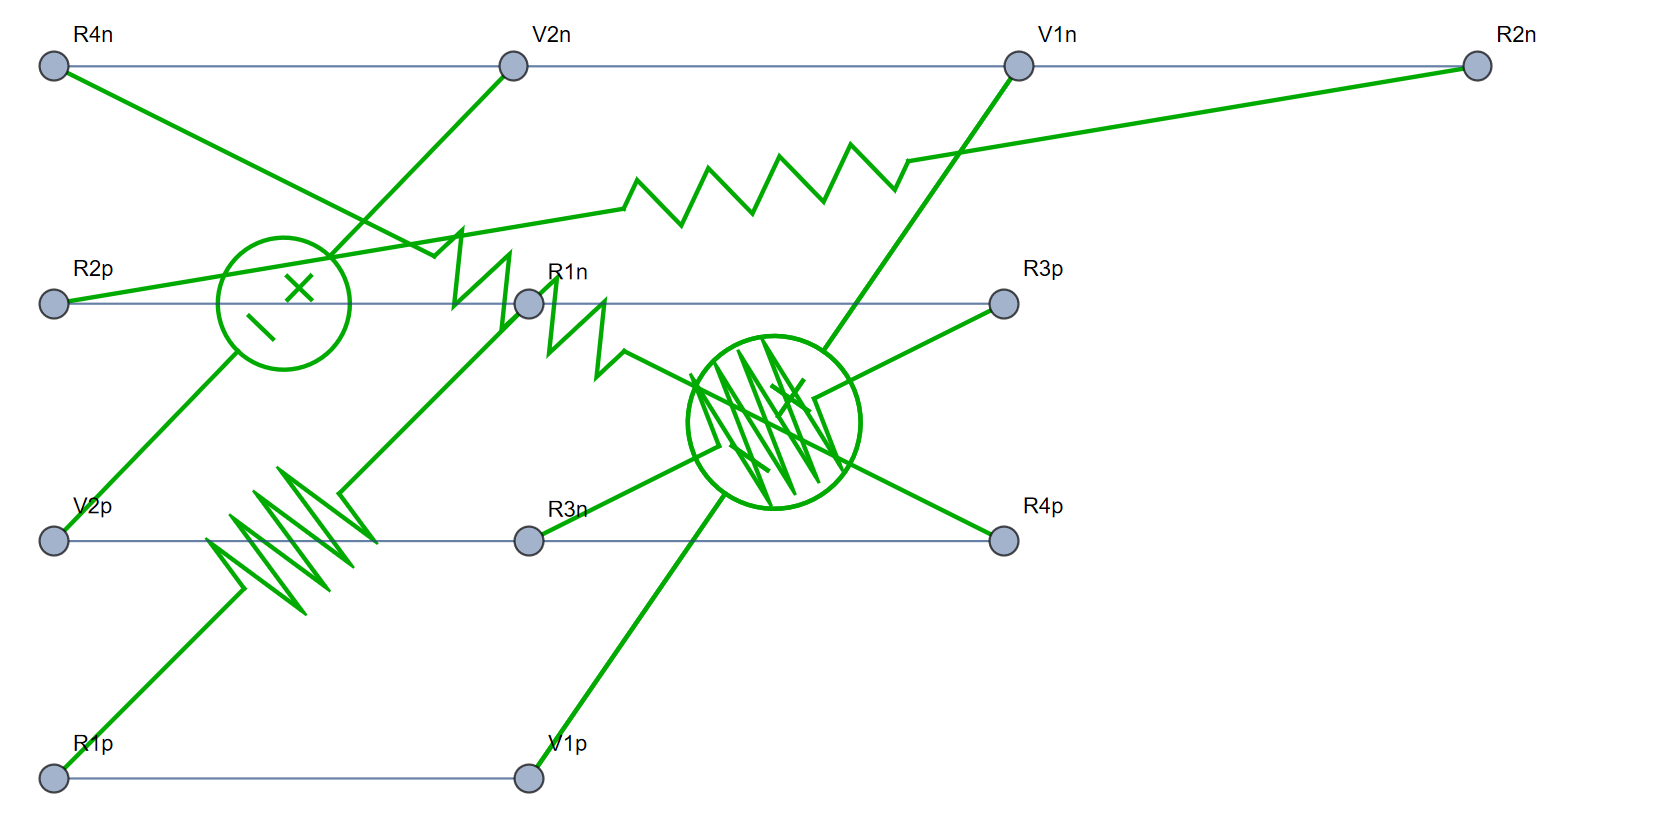
I have tried this (with help from my previous post) but got stuck on how to make graph with constraints above.

resistor[{a1_, a2_}] := 
 Block[{d, l, res, s, t}, d = a2 - a1; l = Norm[d]; 
  s = a1*(1 - 2/5) + a2*(2/5); t = a1*(1 - 3/5) + a2*(3/5); 
      res = 
   Line[Table[{Norm[t - s]*(i/16), (1/(6*l))*Sin[i*(Pi/2)]}, {i, 0, 
      16}]]; 
      res = 
   GeometricTransformation[res, 
    TranslationTransform[s] @* RotationTransform[ArcTan @@ d]]; 
      {Thick, Darker[Green], Line[{{a1, s}, {t, a2}}], res}]
dc[{a1_, a2_}] := 
 Block[{d, l, res, s, t, r}, d = a2 - a1; l = Norm[d]; 
  s = a1*(1 - 2/5) + a2*(2/5); t = a1*(1 - 3/5) + a2*(3/5); 
      r = Norm[s - t]/2; 
  res = {Circle[{r, 0}, r], Line[{{2*(r/4), r/4}, {2*(r/4), -r/4}}], 
          
    Line[{{{r/3 + r, r/4}, {r/3 + r, -r/4}}, {{r/3 + r - r/4, 
        0}, {r/3 + r + r/4, 0}}}]}; 
      res = 
   GeometricTransformation[res, 
    TranslationTransform[s] @* RotationTransform[ArcTan @@ d]]; 
      {Thick, Darker[Green], Line[{{a1, s}, {t, a2}}], res}]
edges = {V1n <-> V2n, V1p <-> R1p, R1n <-> R3p, R1n <-> R2p, 
   R3n <-> R4p, R3n <-> V2p, R4n <-> V2n, R2n <-> V1n}; 
coords = GraphEmbedding[edges]; 
vertexToCoords[{v1_, 
    v2_}] := {Position[VertexList[edges], v1][[1, 1]], 
   Position[VertexList[edges], v2][[1, 1]]}; 
Graph[edges, 
 Prolog -> {resistor[coords[[vertexToCoords[{R1p, R1n}]]]], 
   resistor[coords[[vertexToCoords[{R2p, R2n}]]]], 
       resistor[coords[[vertexToCoords[{R3p, R3n}]]]], 
   resistor[coords[[vertexToCoords[{R4p, R4n}]]]], 
   dc[coords[[vertexToCoords[{V1p, V1n}]]]], 
       dc[coords[[vertexToCoords[{V1p, V1n}]]]], 
   dc[coords[[vertexToCoords[{V2p, V2n}]]]]}, VertexLabels -> "Name"]

enter image description here

There are some problems with the graph:

  1. V1 and V2 are not placed vertically on the left and right.
  2. Vertices of the same components are not placed near each other. For example {R2p, R2n} or {R4p, R4n}.
$\endgroup$
3
  • $\begingroup$ For reference. I think Nodal was the original program to do circuit analysis that was bought by the company called AnalogInsydes but I cannot verify this. A book also talked about this program, but this is old information. $\endgroup$
    – Syed
    Commented Nov 1, 2022 at 15:49
  • $\begingroup$ @Syed yeah, I checked that before but I want to do it automatically instead of manually specifying the coordinates of each components as some components may not exists in the graph. Also I would like to make drawing in the form of graph as above as from that I can extract some information as well. $\endgroup$
    – hana
    Commented Nov 1, 2022 at 15:51
  • $\begingroup$ @Syed the book looks interesting but I think that is a different problem. My goal now is just for ploting and display the graph with some constraints instead of solving the circuits. $\endgroup$
    – hana
    Commented Nov 1, 2022 at 16:01

1 Answer 1

4
+200
$\begingroup$

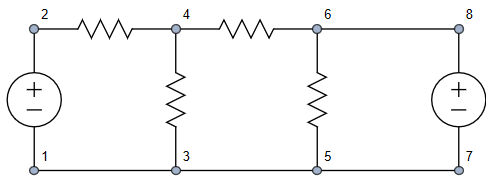
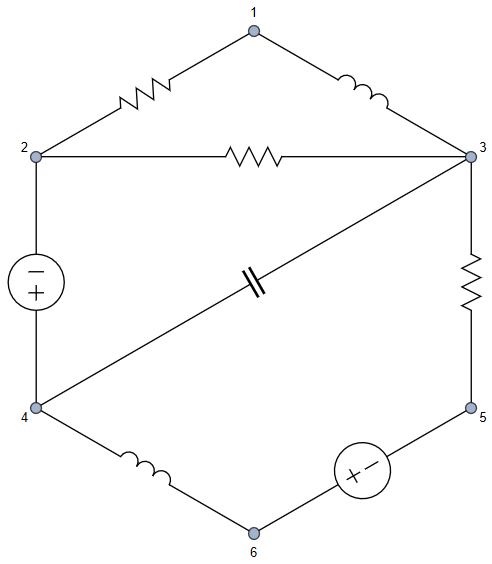
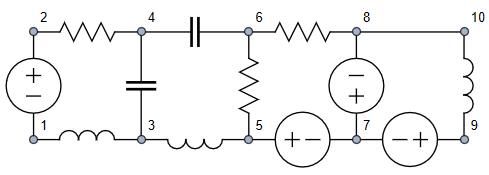
I would use EdgeShapeFunction to have more systematic approach. You can use esf[#1, #2, 4, Reverse] with Reverse as its fourth argument to achieve swapping of +- to -+ of DC sources or to swap orientation of inductors as can be seen on the last image.

esf[pts_List, e_, n_, rev_ : Identity] := 
 Block[{s = 0.03, 
   symbols = {{Opacity[1], White, Rectangle[{-2, -1}, {2, 1}], Black, 
      Line[{{-2, 0}, {-(5/3), 2/3}, {-1, -(2/3)}, {-(1/3), 
         2/3}, {1/3, -(2/3)}, {1, 2/3}, {5/3, -(2/3)}, {2, 
         0}}]}, {Opacity[1], White, Rectangle[{-2, -1}, {2, 1}], 
      Black, Table[
       Circle[{2 k, 0}, 2/3, {0, \[Pi]}], {k, -(2/3), 2/3, 
        2/3}]}, {Opacity[1], White, Rectangle[{-1/4, -1}, {1/4, 1}], 
      Black, Thick, Line[{{-1/4, -1}, {-1/4, 1}}], 
      Line[{{1/4, -1}, {1/4, 1}}]}, {Opacity[1], White, 
      Rectangle[{-2, -1}, {2, 1}], Black, Circle[{0, 0}, 2], 
      Line[{{1/4, 0}, {5/4, 0}}], Line[{{3/4, -1/2}, {3/4, 1/2}}], 
      If[Round[pts[[1, 1]], 1/10] === Round[pts[[2, 1]], 1/10], 
       Line[{{-3/4, -1/2}, {-3/4, 1/2}}], 
       Line[{{-5/4, 0}, {-1/4, 0}}]]}}}, {Arrowheads[{{s, 0.5, 
      Graphics[symbols[[n]]]}}], Arrow[rev[pts]]}]

edges = GridGraph[{2, 4}] // EdgeList;
resistor = UndirectedEdge @@@ {{2, 4}, {3, 4}, {4, 6}, {5, 6}};
inductor = UndirectedEdge @@@ {};
capacitor = UndirectedEdge @@@ {};
dc = UndirectedEdge @@@ {{1, 2}, {7, 8}};

Graph[edges, VertexCoordinates -> Tuples[{Range[4], Range[2]}], 
 EdgeStyle -> Directive[Opacity[1], Black], 
 EdgeShapeFunction -> {(Alternatives @@ 
      resistor) -> (esf[#1, #2, 1] &), (Alternatives @@ 
      inductor) -> (esf[#1, #2, 2] &), (Alternatives @@ 
      capacitor) -> (esf[#1, #2, 3] &), (Alternatives @@ 
      dc) -> (esf[#1, #2, 4] &)}, VertexLabels -> Automatic]

enter image description here

edges = UndirectedEdge @@@ {{1, 2}, {2, 3}, {1, 3}, {3, 4}, {2, 
     4}, {3, 5}, {4, 6}, {5, 6}};
resistor = UndirectedEdge @@@ {{1, 2}, {2, 3}, {3, 5}};
inductor = UndirectedEdge @@@ {{1, 3}, {4, 6}};
capacitor = UndirectedEdge @@@ {{3, 4}};
dc = UndirectedEdge @@@ {{5, 6}, {2, 4}};

Graph[edges, GraphLayout -> "TutteEmbedding", 
 EdgeStyle -> Directive[Opacity[1], Black], 
 EdgeShapeFunction -> {(Alternatives @@ 
      resistor) -> (esf[#1, #2, 1] &), (Alternatives @@ 
      inductor) -> (esf[#1, #2, 2] &), (Alternatives @@ 
      capacitor) -> (esf[#1, #2, 3] &), (Alternatives @@ 
      dc) -> (esf[#1, #2, 4] &)}, VertexLabels -> Automatic]

enter image description here

edges = GridGraph[{2, 5}] // EdgeList;
resistor = UndirectedEdge @@@ {{2, 4}, {5, 6}, {6, 8}};
inductor1 = UndirectedEdge @@@ {{1, 3}};
inductor2 = UndirectedEdge @@@ {{3, 5}, {9, 10}};
capacitor = UndirectedEdge @@@ {{4, 6}, {3, 4}};
dc1 = UndirectedEdge @@@ {{1, 2}, {7, 9}};
dc2 = UndirectedEdge @@@ {{7, 8}, {5, 7}};

Graph[edges, VertexCoordinates -> Tuples[{Range[5], Range[2]}], 
 EdgeStyle -> Directive[Opacity[1], Black], 
 EdgeShapeFunction -> {(Alternatives @@ 
      resistor) -> (esf[#1, #2, 1] &), (Alternatives @@ 
      inductor1) -> (esf[#1, #2, 2] &), (Alternatives @@ 
      inductor2) -> (esf[#1, #2, 2, Reverse] &), (Alternatives @@ 
      capacitor) -> (esf[#1, #2, 3] &), (Alternatives @@ 
      dc1) -> (esf[#1, #2, 4] &), (Alternatives @@ 
      dc2) -> (esf[#1, #2, 4, Reverse] &)}, VertexLabels -> Automatic]

enter image description here

$\endgroup$
9
  • 1
    $\begingroup$ The drawing looks really nice but would the coordinates of each elements are automatically asigned and satisfying some constraints above. For example, assume that I have a graph with two dc voltage sources V1, V2, one inductor L1 and one capacitor C1. So the vertices would be V1p, V1n, L1p, L1n, C1p, C1n corresponding to their positive and negative terminal. Assume that I have the edges connection. Would it be automatically place these components so that V1, V2 is always on the left and right and vertices in the same pair {L1p, L1n}, {C1p, C1n} are placed near each other? $\endgroup$
    – hana
    Commented Nov 4, 2022 at 20:24
  • $\begingroup$ Something like in the image below. Assume that the edges are given. DC voltage sources V1, V2 may exist or not. Also some passive components may be removed or added. If V1 or V2 exist then I want to place V1 on the left, V2 on the right. And all passive components in the middle region between V1 and V2. (there are no other voltage sources other than V1 and V2). Also I want to make sure that vertices of the same components such as {V1p, V1n}, {V2p, V2n}, {L1p, L1n}, {C1p, C1n} are placed closed to each other. ibb.co/cCpJmPD $\endgroup$
    – hana
    Commented Nov 4, 2022 at 20:29
  • $\begingroup$ If I do it automatically then some cases for example L1p is placed on the left and L1n is placed very far away on the right so it looks bad. $\endgroup$
    – hana
    Commented Nov 4, 2022 at 20:30
  • $\begingroup$ It is easy - the two sources should always be placed on edge {1,2} and edge defined by last two vertices, say {9,10}, as can be seen on my last image. $\endgroup$ Commented Nov 4, 2022 at 20:31
  • $\begingroup$ But what if V1 or V2 or both of them doesn't exist in the edges. Probably I can write some condition to check if they're in the edges or not. Another problem is that the placement of vertices of the same elements like L1p, L1n. If you drawing manually it's easy to specify their positions to make them looks nice. However, if it's done automatically then L1p and L1n are probably placed very far from each other. $\endgroup$
    – hana
    Commented Nov 4, 2022 at 20:35

Your Answer

By clicking “Post Your Answer”, you agree to our terms of service and acknowledge you have read our privacy policy.

Not the answer you're looking for? Browse other questions tagged or ask your own question.