0
$\begingroup$

I have a function of two variables, say $f(a, b)$, which I want to evaluate (and later average) in the neighborhood of $a=0$ and $b=0$, with density of points around $(a,\,b)$ following a Gaussian distribution.

Taking the example of the first variable $a$, the largest number of points should be at $a = 0$ (peak of the Gaussian distribution) and then on both sides of the $a$-axis the density of the points should decrease according to a Gaussian distribution.

Will appreciate any help.

$\endgroup$
3
  • 1
    $\begingroup$ Look for NormalDistribution[\[Mu],\[Sigma]] $\endgroup$ Commented Jan 16, 2021 at 13:22
  • $\begingroup$ What exactly follows a Gaussian distribution? Do you have a nonlinear regression with $y=f(a,b) + \epsilon$ with $\epsilon\sim N(0,\sigma^2)$ or do you have errors in the predictor variables $y=f(a+\epsilon_a, b+\epsilon_b)$ where $(\epsilon_a,\epsilon_b)$ follows a bivariate Gaussian distribution? $\endgroup$
    – JimB
    Commented Jan 16, 2021 at 17:46
  • 1
    $\begingroup$ If the objective is to describe the distribution of $f$ (pdf, mean, variance, etc.) given that $(a,b)$ has a bivariate Gaussian distribution, have you tried TransformedDistribution ? $\endgroup$
    – JimB
    Commented Jan 16, 2021 at 18:56

1 Answer 1

2
$\begingroup$

Something like:

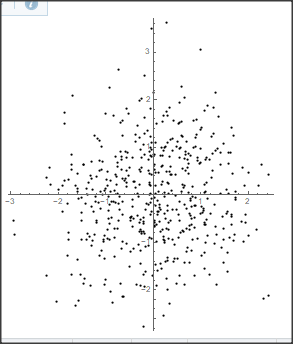
dist = MultinormalDistribution[IdentityMatrix[2]]
pts = RandomVariate[dist, 500];
Graphics[Point[pts], Axes -> True]

enter image description here

You may chose a different variance var by e.g.:

dist = MultinormalDistribution[ var IdentityMatrix[2]]
$\endgroup$
3
  • $\begingroup$ Thanks. It's working but Gaussian distribution is always defined by HWFM/FWHM. How can I input it in the format you suggested. $\endgroup$
    – user49535
    Commented Jan 16, 2021 at 20:06
  • $\begingroup$ HWFM - Half width at full maxima. Another way to define the width of a peak in some functions, but FWHM is enough. As you said, "var" is the 4Log(2/FWHM^2). Can you suggest any reference for it. Just trying to understand "MultinormalDistribution" better. Description given on Mathematica is too complicated and does not talk about FWHM. Thanks $\endgroup$
    – user49535
    Commented Jan 17, 2021 at 12:21
  • $\begingroup$ In your case you have a diagonal correlation matrix. That means the distribution is rotational symmetric. If you take a cut along the x-axis you get a simple 1 dim Gaussian. Then google "Gaussian" and e.g. the Wiki will give you the necessary information. $\endgroup$ Commented Jan 17, 2021 at 12:44

Not the answer you're looking for? Browse other questions tagged or ask your own question.