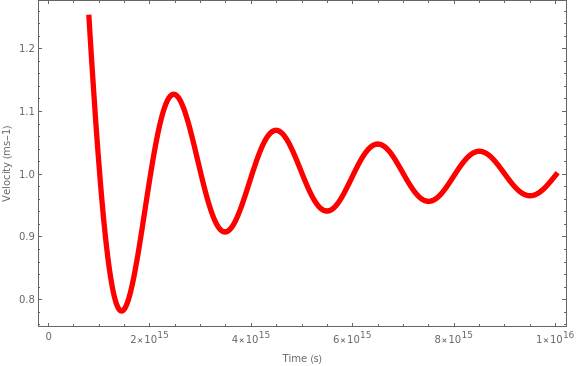
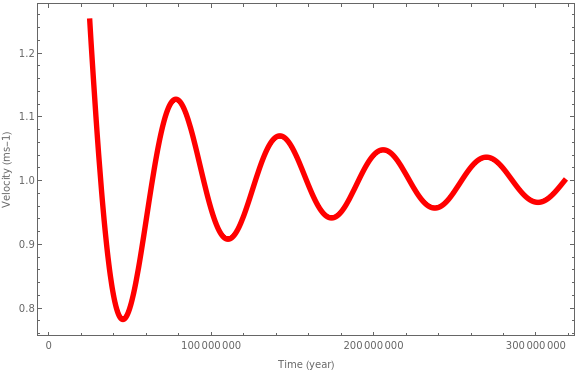
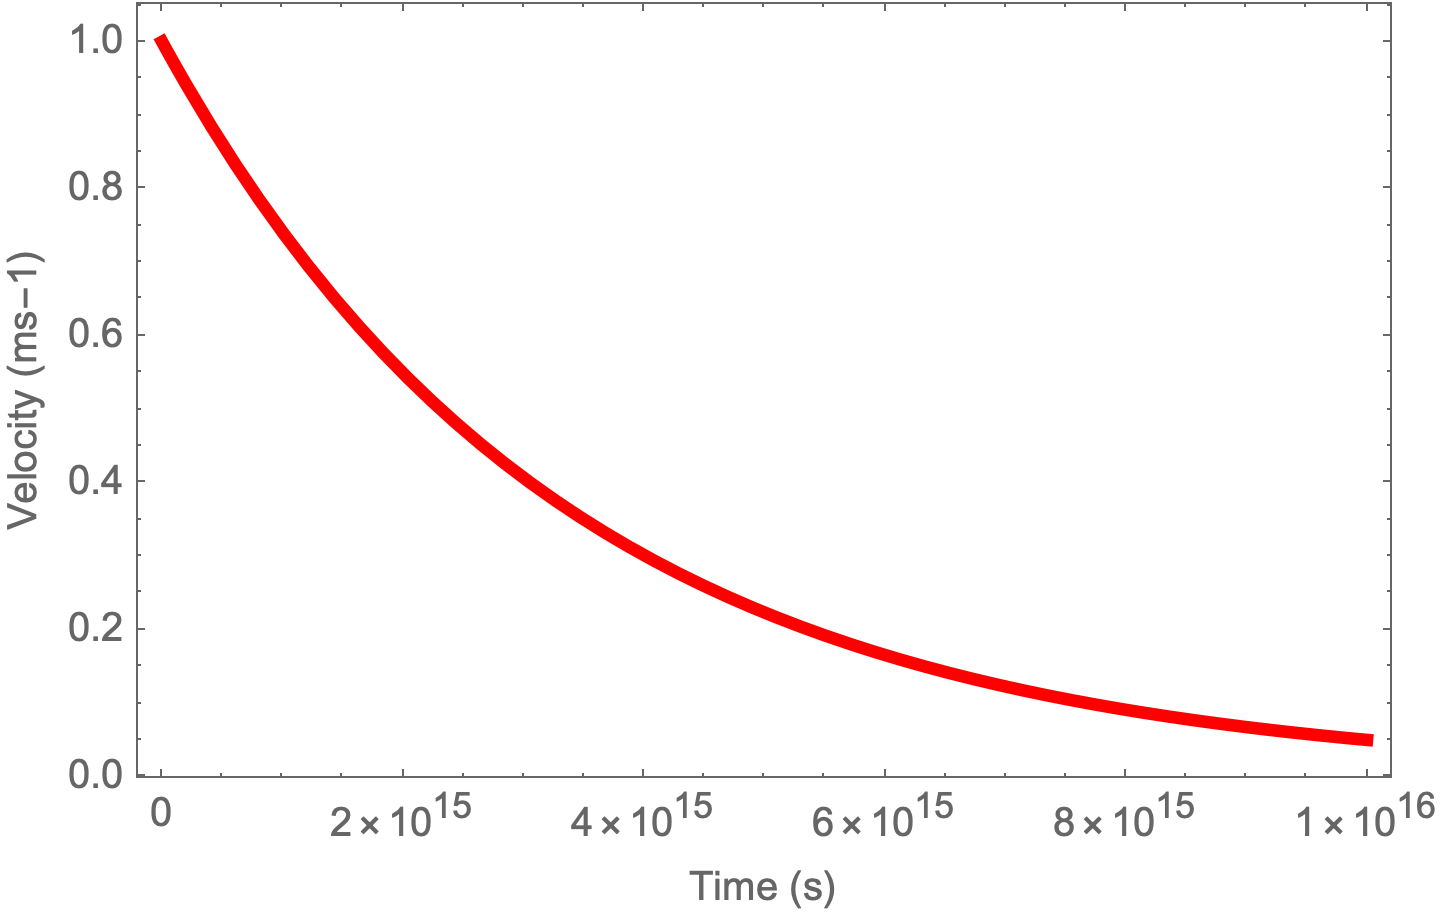
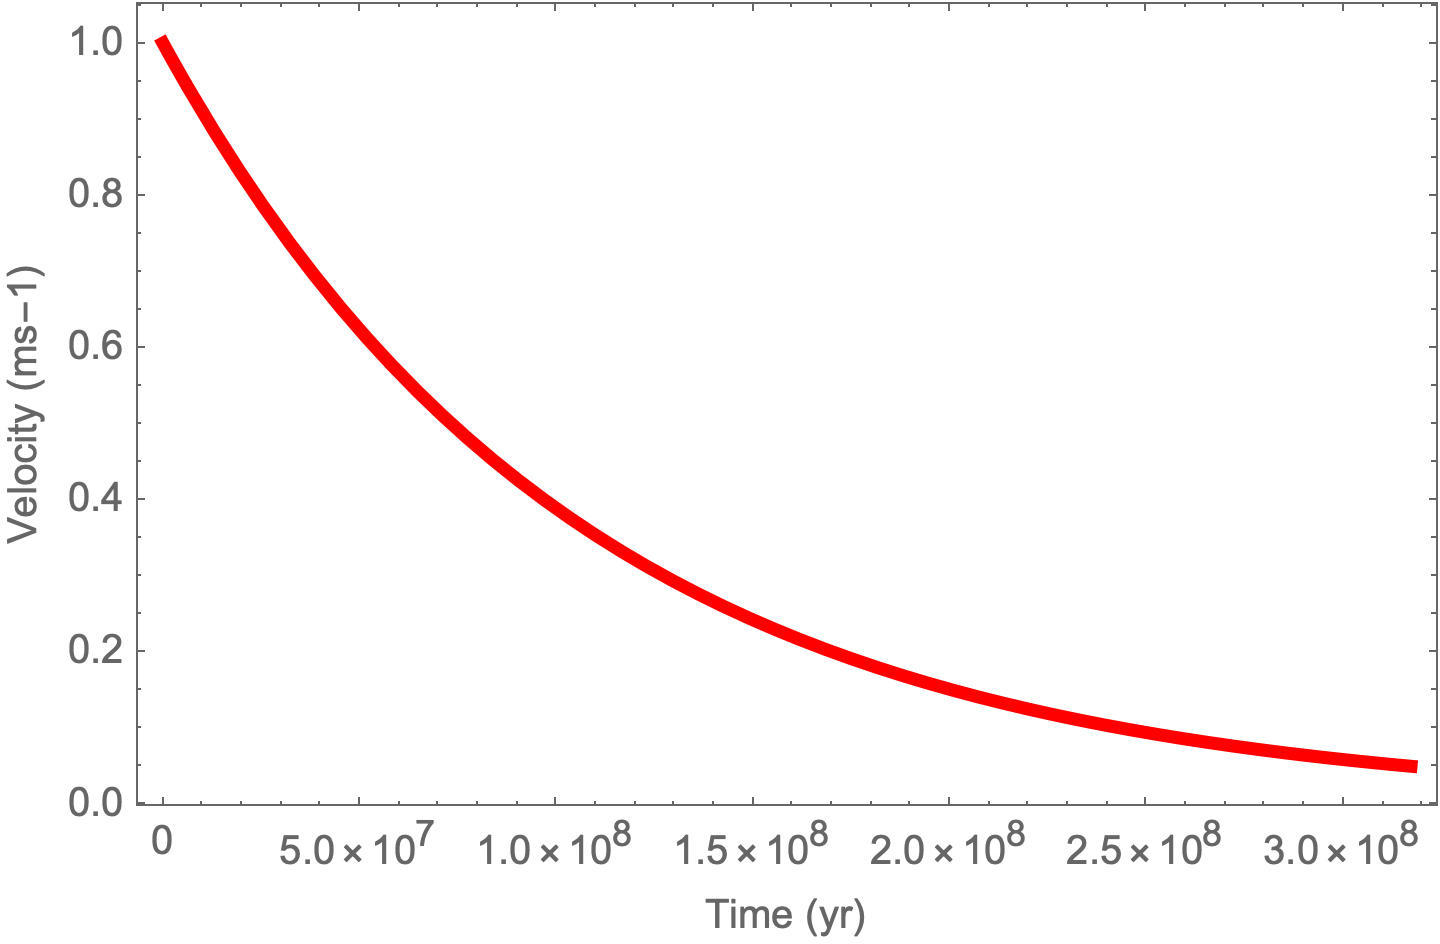
I have plotted a graph in mathematica, where the x axis is in seconds. I want to scale the axis so it displays years instead.
My plotting function is as follows:
Plot[sol1[t], {t, 0, 1 * 10^(16)},
   PlotRange -> All
   FrameLabel -> {"Time (s)", "Velocity (ms-1)"},
   PlotStyle -> {Red, Thickness[0.01]}]
Any help would be appreciated.


