3
$\begingroup$

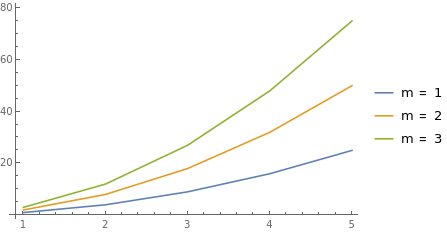
Is there a way I can sensibly automate the PlotLegends expressions within plot so as to correctly label each curve even when I change some of the initial parameter values? For example, consider the plot

a = 1;
b = 3;
c = 1;
ListPlot[Table[Table[{n, m n^2}, {n, 1, 5}], {m, a, b, c}], 
 Joined -> True, PlotLegends -> {"m=1", "m=2", "m=3"}]

I've got the values in the PlotLegends expressions specific to the values of $a$, $b$ and $c$ I've used initially. Is there a way to generate a table (for example) for PlotLegends along the lines of

a = 1;
b = 3;
c = 1;
ListPlot[Table[Table[{n, m n^2}, {n, 1, 5}], {m, a, b, c}], 
 Joined -> True, PlotLegends ->Table[{"a+(n-1)c"},{n,1,(b-a)/c+1}]]

This itself doesn't work but I'd imagine something similar might?

Thanks in advance for any help.

$\endgroup$

4 Answers 4

1
$\begingroup$

I guess, the simplest way is pre-defining the list of names for legend entries. Let's say, like this:

 lbls = Table["m=" <> ToString[m], {m, {1, 2, 3}}];

 ListPlot[Table[{n, m n^2}, {m, {1, 2, 3}}, {n, 1, 5}], 
          Joined -> True,
          PlotLegends -> lbls]

Actually, any feature of PlotLegend can be pre-defined (styling labels, frame style, etc).

$\endgroup$
6
$\begingroup$

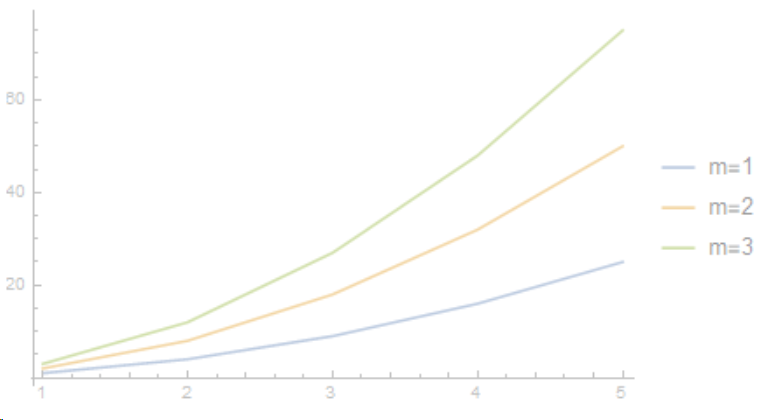
I think the easiest way is to use the fact that most plotting functions use association keys as legend entries when you give them the data in the form <|"key1"->data1,...|>:

a = 1; b = 3; c = 1;
ListPlot[
 <|
  Table[
   StringTemplate["m=``"][m] ->
    Table[{n, m n^2}, {n, 1, 5}],
   {m, a, b, c}
   ]
  |>,
 Joined -> True
 ]

enter image description here

Note also the use of StringTemplate to build the key/legend entry. This also has the advantage that you keep the data and labels together. (since you don't need to take care that the list of legend entries is the same length and in the same order as the data)

$\endgroup$
4
$\begingroup$

Nested Tables can be coded with a single Table.

a = 1;
b = 3;
c = 1;
nmax = 5;

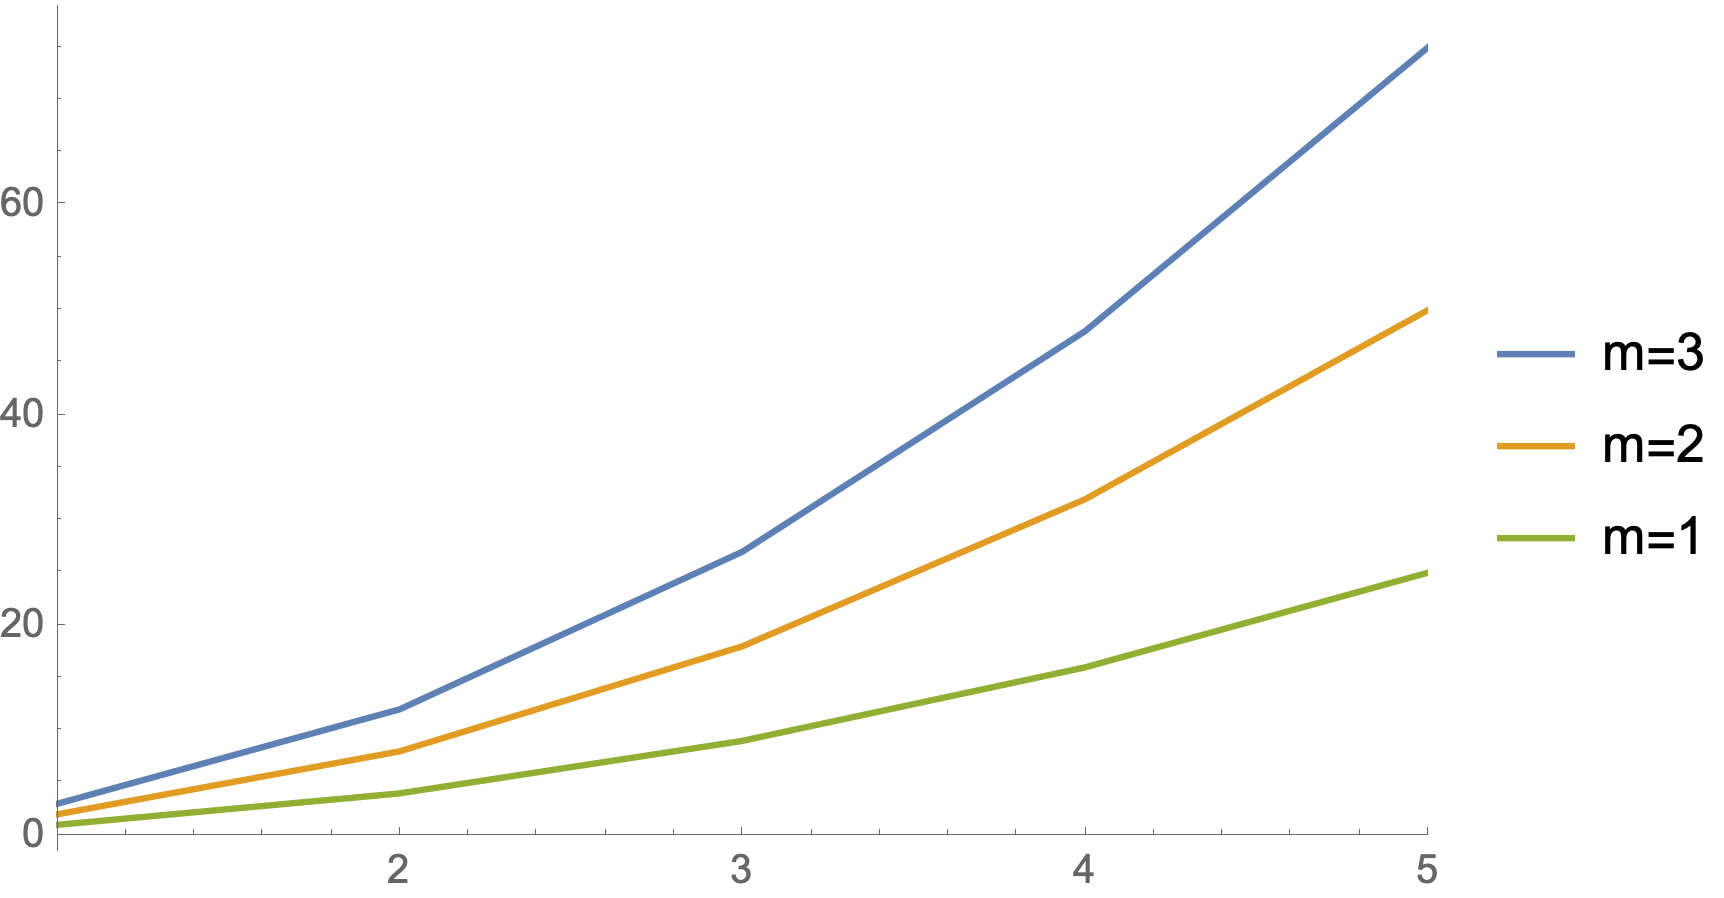
ListLinePlot[
 Table[m n^2, {m, b, a, -c}, {n, nmax}],
 PlotLegends ->
  (StringForm["m=``", #] & /@ Range[b, a, -c]), 
 PlotRange -> {{1, nmax}, Automatic}]

enter image description here

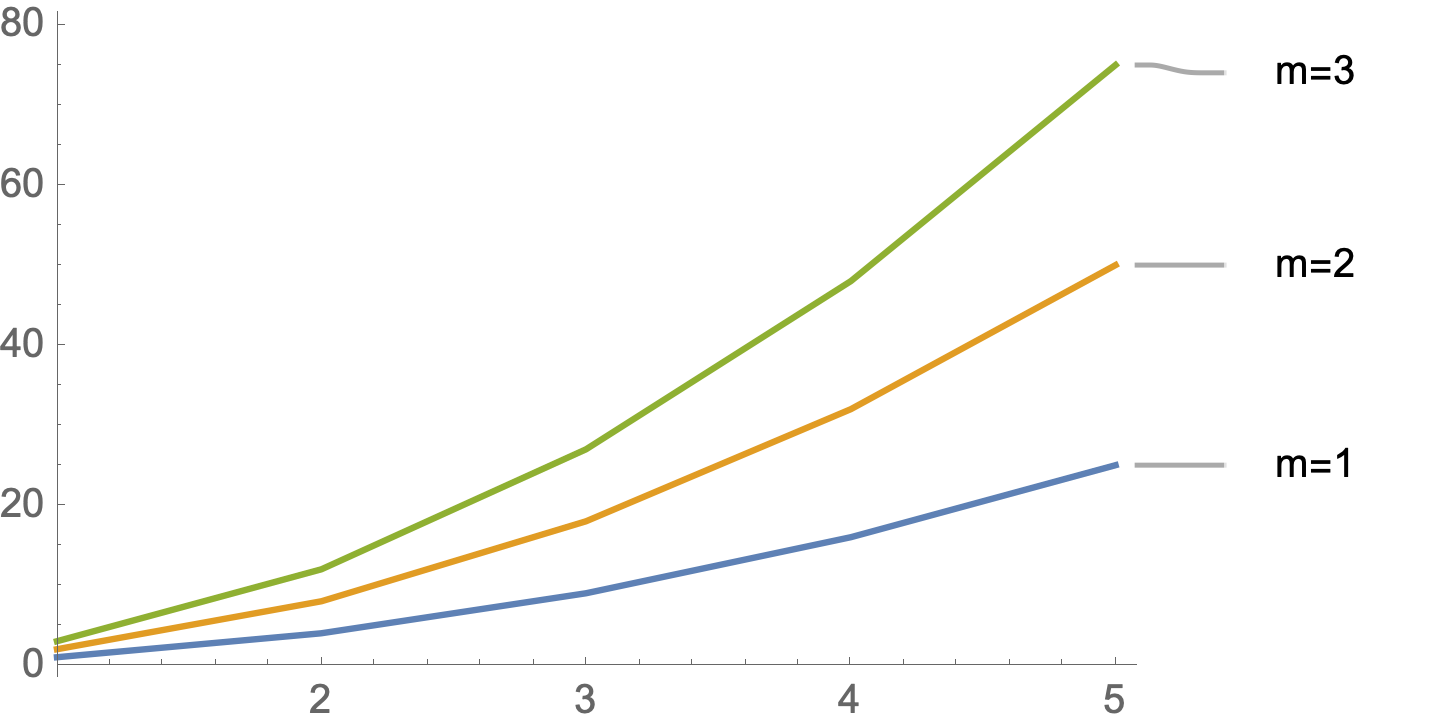
Or using PlotLabels

ListLinePlot[
 Table[m n^2, {m, a, b, c}, {n, nmax}],
 PlotLabels ->
  (StringForm["m=``", #] & /@ Range[a, b, c]), 
 PlotRange -> {{1, nmax}, Automatic}]

enter image description here

$\endgroup$
3
$\begingroup$
a = 1; b = 3; c = 1;
data = Table[Table[{n, m n^2}, {n, 1, 5}], {m, a, b, c}];

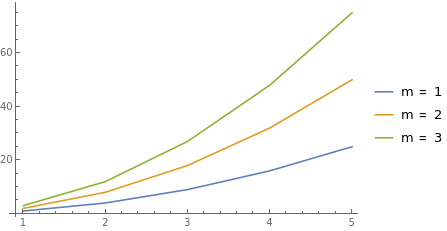
Recently bumped into a built-in function PromptForm that can be used for the current task:

ListPlot[data, Joined -> True, PlotLegends -> (PromptForm["m", #] & /@ Range[3])] 

enter image description here

Using Lukas Lang's method with PromptForm:

ListPlot[AssociationThread[PromptForm["m", #] & /@ Range[3], data], Joined -> True]

enter image description here

$\endgroup$
0

Your Answer

By clicking “Post Your Answer”, you agree to our terms of service and acknowledge you have read our privacy policy.

Not the answer you're looking for? Browse other questions tagged or ask your own question.