1
$\begingroup$

I have data in list b3, First step is normalizing the histogram using the following command, Histogram[b3, 100, "ProbabilityDensity"]

Second I would like to make the y scale log, I use

Histogram[b3, 1000, "ProbabilityDensity", "LogCount"]

But this is not working.

$\endgroup$

1 Answer 1

2
$\begingroup$
SeedRandom[1]
b3 = RandomVariate[NormalDistribution[0, 1], 1000];

Use the form {"Log", hspec} in the third argument of Histogram to get log transformed heights (see Histogram >> Details and Options):

Histogram[b3, 100, {"Log", "PDF"}]
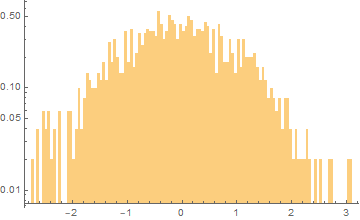
enter image description here

Alternatively, use the option ScalingFunctions:

Histogram[b3, 100, "PDF", ScalingFunctions -> {None, "Log"}]
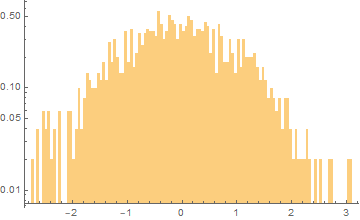
enter image description here

Note: Height specification "ProbabilityDensity" (afaik) is not documented and it gives the same height list as "PDF":

HistogramList[b3, 100, "PDF"][[2]] == 
 HistogramList[b3, 100, "ProbabilityDensity"][[2]]
 True
HistogramList[b3, 100, {"Log", "PDF"}][[2]] == 
 HistogramList[b3, 100, {"Log", "ProbabilityDensity"}][[2]]
 True
$\endgroup$
4
  • $\begingroup$ Thank a lot, it is very helpful. $\endgroup$ Commented Nov 11, 2020 at 5:10
  • $\begingroup$ @SachinKaushik, my pleasure. Thank you for the accept. $\endgroup$
    – kglr
    Commented Nov 11, 2020 at 5:33
  • $\begingroup$ If i further want to divide y axis by 2 then how can i include it. Question is i have data, first step is obtaining normalized histogram which you showed and then divide the y axis of histogram by 2, keeping everything else same. $\endgroup$ Commented Nov 25, 2020 at 3:25
  • $\begingroup$ @SachinKaushik, you can use something like: hl = HistogramList[b3, 100, "PDF"]; Histogram[b3, {hl[[1]]}, hl[[2]]/2 &, ScalingFunctions -> {None, "Log"}] $\endgroup$
    – kglr
    Commented Nov 25, 2020 at 3:57

Your Answer

By clicking “Post Your Answer”, you agree to our terms of service and acknowledge you have read our privacy policy.

Not the answer you're looking for? Browse other questions tagged or ask your own question.