4
$\begingroup$

I generated lines and circles:

lines = Table[
   Graphics[
    Line[{{RandomInteger[{0, 10}], 
       RandomInteger[{0, 10}]}, {RandomInteger[{0, 10}], 
       RandomInteger[{0, 10}]}}], ImageSize -> 10], {x, 1, 20}];
circles = 
  Table[Graphics[
    Circle[{RandomInteger[{0, 10}], RandomInteger[{0, 10}]}, 
     RandomInteger[{0, 20}]], ImageSize -> 10], {x, 1, 20}];

and put them into a classifier

c = Classify[{lines -> "lines", circles -> "circles"}]

the training was successful with no errors, but when trying to test the classifier with:

test = Graphics[Line[{{0, 1}, {0, 2}}], ImageSize -> 10]
c[test]

I get the error:

ClassifierFunction::mlbddataev: The data being evaluated is not formatted correctly.

And I do not understand what the problem is. Can somebody tell me, how to correctly format the data?

$\endgroup$

1 Answer 1

6
$\begingroup$

This is the way I would do it.

  • Data needs to be Association, not list, when you label by the whole batches and not single objects.
  • A good training set has varying data, not almost identical. Hence, carefully design Graphics so circles and lines are different sizes and in different places. You can also add noise (like random points), but I did not do it for simplicity.
  • Experiment with larger training sets to see improvement of accuracy.
  • PerformanceGoal->"Quality" is recommended for more accurate results.
  • This case works out well with Graphics but in more complex cases you can always consider converting Graphics to Image with Rasterize and using Neural Networks.

Training set:

lines = ParallelTable[Graphics[{Thick,Line[RandomReal[10,{2,2}]]}, 
ImageSize -> 50,PlotRange->{{0,10},{0,10}}], {x, 1, 100}];

circles = ParallelTable[Graphics[{Thick,Circle[RandomReal[{3,7},2], RandomReal[{1,3}]]},
ImageSize -> 50,PlotRange->{{0,10},{0,10}}], {x, 1, 100}];

Here is a sample (frames are only to stress varying locations of lines and circles within the Graphics):

Framed /@ RandomSample[lines~Join~circles, 10]

enter image description here

Train:

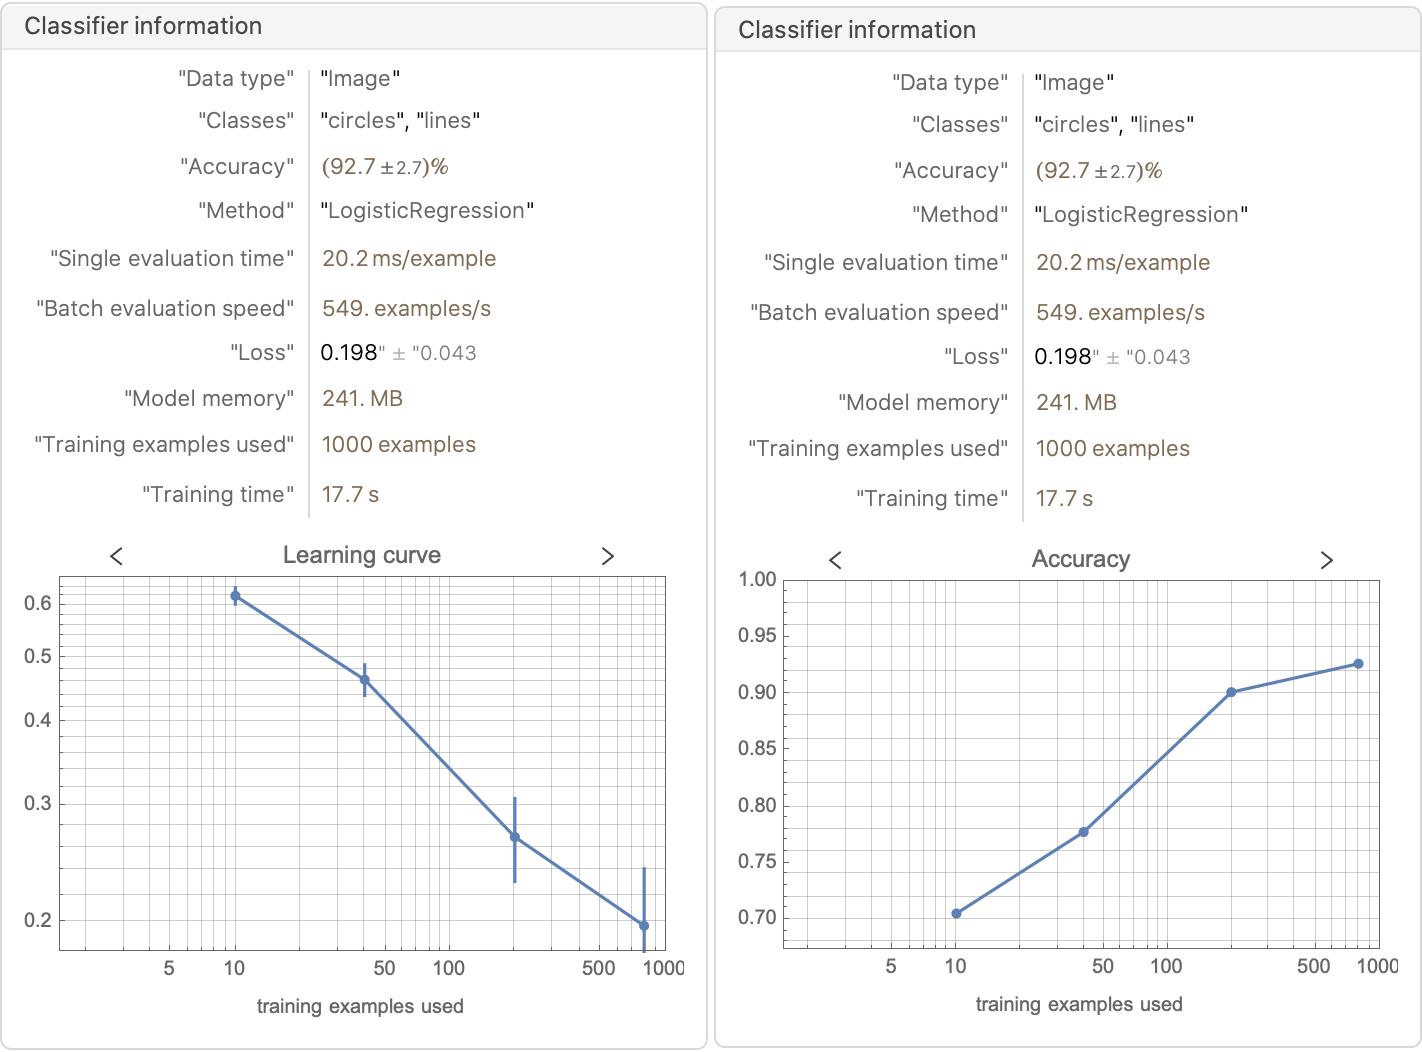
c=Classify[<|"lines"->lines,"circles"->circles|>,PerformanceGoal->"Quality"]

Information[c]

enter image description here

Test set:

linesTEST=ParallelTable[Graphics[{Thick,Line[RandomReal[10,{2,2}]]}, 
ImageSize -> 100,PlotRange->{{0,10},{0,10}}], {x, 1, 20}];

circlesTEST = ParallelTable[Graphics[{Thick,Circle[RandomReal[{3,7},2], RandomReal[{1,3}]]},
ImageSize -> 50,PlotRange->{{0,10},{0,10}}], {x, 1, 20}];

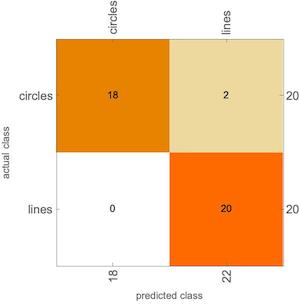
Measure performance:

cm=ClassifierMeasurements[c,<|"lines"->linesTEST,"circles"->circlesTEST|>]

cm["ConfusionMatrixPlot"]

enter image description here

$\endgroup$
8
  • $\begingroup$ c = Classify[<|"lines" -> lines, "circles" -> circles|>, PerformanceGoal -> "Quality"] does not work for me, outputting "ClassifierFunction[Input type: Image Classes: circles,lines Data not in notebook; Store now ». ]". $\endgroup$
    – user64494
    Commented Oct 19, 2020 at 11:41
  • $\begingroup$ @user64494 it is not an error. $\endgroup$ Commented Oct 19, 2020 at 13:13
  • $\begingroup$ @Vtaliy Kaurov: You wrote "it is not an error". However, after that the rest of your code does not work for me in 12.1.1.0 on Windows 10, resultng in "ClassifierMeasurementsObject[Classifier: LogisticRegression Number of test examples: 40 Data not in notebook; Store now » ]". $\endgroup$
    – user64494
    Commented Oct 19, 2020 at 13:22
  • 1
    $\begingroup$ Works for me in 12.1.1.0 on Windows 10. I also get "Data not in notebook; Store now" in the ClassifierFunction and that's not an error. Get the same results as the answer. @user64494 $\endgroup$
    – anderstood
    Commented Oct 19, 2020 at 14:15
  • 1
    $\begingroup$ Thank you, I was not aware of the use of Associations in this case. But it works well for me! $\endgroup$
    – holistic
    Commented Oct 20, 2020 at 7:39

Your Answer

By clicking “Post Your Answer”, you agree to our terms of service and acknowledge you have read our privacy policy.

Not the answer you're looking for? Browse other questions tagged or ask your own question.