2
$\begingroup$

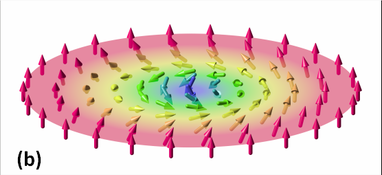
A skyrmion

I want to plot a skyrmion (like shown above) represented by a 3D vectorial arrows but showing in a 2D plane.

My code is as follows:

λ = 633*10^(-9);
ω = 2*π*3*10^8/λ;
k0 = 2 π/λ;
kr = 1.05*k0;
kz = Sqrt[kr^2 - k0^2];
Fr = 
  Plot[{0.8*kz*kr^2/(2*ω)*1/r*BesselJ[1, kr*r]^2/(4.96*10^11)}, 
    {r, -1.5*λ, +1.5*λ}, 
    PlotRange -> All]

Fθ = 
  Plot[{0.2*kz*kr^2/(2*ω)*1/r*BesselJ[1, kr*r]^2/(4.96*10^11)}, 
    {r, -1.5*λ, +1.5*λ}, 
    PlotRange -> All]

Fz = 
  Plot[{kr^3/(2*ω)*1/r*BesselJ[1, kr*r]*(BesselJ[0, kr*r] - 
          BesselJ[2, kr*r])/2/(4.96*10^11)}, 
    {r, -1.5*λ, +1.5*λ}, 
    PlotRange -> All]

I used 4.96*10^11 to normalize the data.

As you can see, Fr, and Fz are in cylindrical coordinate, but there is only one variable, r with {r, -1.5 λ, +1.5 λ}.

I've searched all day through this forum and tried VectorPlot3D, ListVectorPlot3D, but failed.

Please, can anybody help me to solve this?

$\endgroup$
1

2 Answers 2

3
$\begingroup$

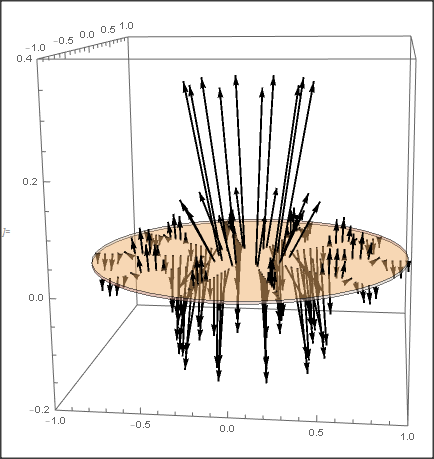
My understanding is, that you have a vector field, given in cylindrical coordinates, that only depends on the radius r (Note r should be >0 in cylindrical coordinates). And you want to plot the vectors in a slice with z==0.

Toward this aim we first define the coordinate functions r[r], \[Theta][r] and z[r] that give the cylindrical coordinates.

Then we need the three cylinder base vectors in cartesian coordinates for our plot. This is done with the the function cylbas[x,y]

Next, as the vectors depend only on r, we define a function vec0[r] that gives the cartesian components of the searched for vectors in the y==z==0 plane.

Then we rotate the vectors in the plane y==z==0 around the z-axis. This gives a table of vector called: vecs

Finally we feed vecs to Graphics3D, where we change the vectors to Arrows. Here is the code:

\[Lambda] = 633*10^(-9);
\[Omega] = 2*\[Pi]*3*10^8/\[Lambda];
k0 = 2 \[Pi]/\[Lambda];
kr = 1.05*k0;
kz = Sqrt[kr^2 - k0^2];

r[r_] = 0.8*kz*kr^2/(2*\[Omega])*1/r*BesselJ[1, kr*r]^2/(4.96*10^11);
\[Theta][r_] = 
  0.2*kz*kr^2/(2*\[Omega])*1/r*BesselJ[1, kr*r]^2/(4.96*10^11);
z[r_] = kr^3/(2*\[Omega])*1/r*
   BesselJ[1, 
    kr*r]*(BesselJ[0, kr*r] - BesselJ[2, kr*r])/2/(4.96*10^11);

cylbase[x_, 
   y_] = {{Cos[ph], Sin[ph], 0}, 
    Sqrt[x^2 + y^2] {- Sin[ph], Cos[ph], 0 }, {0, 0, 1}} /. 
   ph -> ArcTan[x, y];

vec0[r_] = 
  Arrow[{{r, 0, 
     0}, {r, 0, 
      0} + {r[r \[Lambda]], \[Theta][r \[Lambda]], 
       z[r \[Lambda]]}.cylbase[r, 0 ]}];

vecs = Table[
   Rotate[Table[vec0[r ], {r, Table[i, {i, 0.2, 1, 0.05}]}], 
    ph, {0, 0, 1}], {ph, 0, 2 Pi, Pi/5}];

Graphics3D[{Thickness[0.005], 
  Arrowheads[Medium, Appearance -> "Projected"], vecs, Opacity[0.3], 
  Cylinder[{{0, 0, 0}, {0, 0, 0.005}}, 1]}, 
 PlotRange -> {{-1., 1.}, {-1., 1.}, {-.2, 0.4}}, ImageSize -> 400, 
 Axes -> True, BoxRatios -> {1, 1, 1}]

enter image description here

$\endgroup$
6
  • $\begingroup$ Great job! Almost there, how to make the arrows in the same size? I tried to put Scale inside Arrowheads but nothing changed. $\endgroup$
    – Eric Z
    Commented Oct 10, 2020 at 0:50
  • $\begingroup$ The length of the arrows indicate the magnitude of the vector. You really want all vector the same length? $\endgroup$ Commented Oct 10, 2020 at 7:30
  • $\begingroup$ Yes, I just want to show the winding trend of these arrows, so it's better to make them in same length. $\endgroup$
    – Eric Z
    Commented Oct 10, 2020 at 7:32
  • $\begingroup$ make this change to vec0: vec0[r_] = Arrow[{{r, 0, 0}, {r, 0, 0} + 0.2 Normalize@{r[r [Lambda]], [Theta][r [Lambda]], z[r [Lambda]]}.cylbase[r, 0]}]; and change Graphics3D to: Graphics3D[{Thickness[0.008], Arrowheads[Appearance -> "Projected"], vecs, Opacity[0.3], Cylinder[{{0, 0, 0}, {0, 0, 0.005}}, 1]}, PlotRange -> {{-1., 1.}, {-1., 1.}, {-1, 1}}, ImageSize -> 400, Axes -> True, BoxRatios -> {1, 1, 1}] $\endgroup$ Commented Oct 10, 2020 at 7:49
  • $\begingroup$ That works perfectly, thanks! $\endgroup$
    – Eric Z
    Commented Oct 10, 2020 at 10:29
3
$\begingroup$

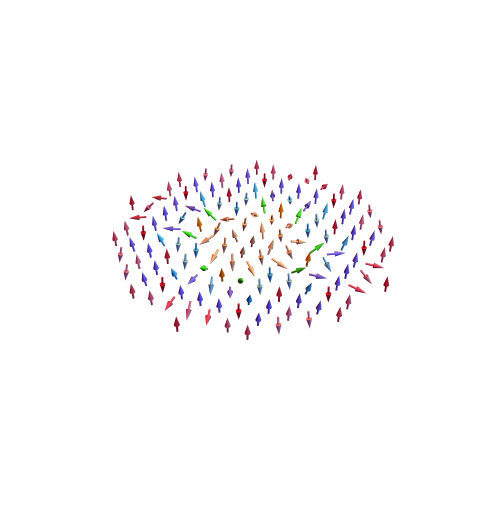
Whether meet your requirements?

Clear["`*"];
λ = 633*10^(-9);
ω = 2*π*3*10^8/λ;
k0 = 2 π/λ;
kr = 1.05*k0;
kz = Sqrt[kr^2 - k0^2];
Fr = 0.8*kz*kr^2/(2*ω)*1/r*BesselJ[1, kr*r]^2/(4.96*10^11);
Fθ = 
  0.2*kz*kr^2/(2*ω)*1/r*BesselJ[1, kr*r]^2/(4.96*10^11);
Fz = kr^3/(2*ω)*1/r*
   BesselJ[1, 
    kr*r]*(BesselJ[0, kr*r] - BesselJ[2, kr*r])/2/(4.96*10^11);
{r, θ, z} = {Sqrt[x^2 + y^2], ArcTan[x, y], z};
{Fx, Fy, Fz} = {Fr, Fθ, 
      Fz}.D[{r, θ, z}, {{x, y, z}}] /. r -> Sqrt[x^2 + y^2] // 
   Simplify;
vectors = 
 VectorPlot3D[{Fx, Fy, Fz}, {x, -1.5, 1.5}, {y, -1.5, 1.5}, {z, -1.5, 
   1.5}, VectorColorFunction -> "BrightBands", PlotTheme -> "Classic",
   VectorPoints -> {15, 15, 5}, 
  RegionFunction -> 
   Function[{x, y, z}, Abs[z] <= .5 && Sqrt[ x^2 + y^2] <= 1.5], 
  Boxed -> False, Axes -> False, RegionBoundaryStyle -> None, 
  PlotRange -> Full]

Another code

Clear["`*"];
\[Lambda] = 633*10^(-9);
\[Omega] = 2*\[Pi]*3*10^8/\[Lambda];
k0 = 2 \[Pi]/\[Lambda];
kr = 1.05*k0;
kz = Sqrt[kr^2 - k0^2];
Fr = 0.8*kz*kr^2/(2*\[Omega])*1/r*BesselJ[1, kr*r]^2/(4.96*10^11);
F\[Theta] = 
  0.2*kz*kr^2/(2*\[Omega])*1/r*BesselJ[1, kr*r]^2/(4.96*10^11);
Fz = kr^3/(2*\[Omega])*1/r*
   BesselJ[1, 
    kr*r]*(BesselJ[0, kr*r] - BesselJ[2, kr*r])/2/(4.96*10^11);
{r, \[Theta], z} = {Sqrt[x^2 + y^2], ArcTan[x, y], z};
{Fx, Fy, Fz} = {Fr, F\[Theta], 
      Fz}.D[{r, \[Theta], z}, {{x, y, z}}] /. r -> Sqrt[x^2 + y^2] // 
   Simplify;
SliceVectorPlot3D[{Fx, Fy, Fz}, 
 z == 0, {x, -1.5, 1.5}, {y, -1.5, 1.5}, {z, -1.5, 1.5}, 
 VectorColorFunction -> "BrightBands", PlotTheme -> "Classic", 
 Boxed -> False, Axes -> False]

enter image description here

$\endgroup$
6
  • $\begingroup$ Looks good to me, very nice. Go ahead. $\endgroup$ Commented Oct 10, 2020 at 16:54
  • $\begingroup$ the picture looks pretty, but is there something missing in the code? I ran it on my computer, and it says: Unknown option RegionBoundaryStyle->None. Then I deleted RegionBoundaryStyle->None, it gives me only one arrow. $\endgroup$
    – Eric Z
    Commented Oct 11, 2020 at 1:46
  • $\begingroup$ @EricZ I'm using 12.1.1 . You can test another code which I updated. $\endgroup$
    – cvgmt
    Commented Oct 11, 2020 at 2:10
  • $\begingroup$ Great, many thanks for the code! $\endgroup$
    – Eric Z
    Commented Oct 11, 2020 at 2:17
  • $\begingroup$ @cvgmt, I try to run your code both, and it doesn't work on my pc, the first one says RegionBoundaryStyle is not an option for the 3D plot, the second doesn't look similar to the plot in the solution. Please can you check it, maybe I miss something, thanks $\endgroup$
    – irondonio
    Commented Oct 19, 2020 at 13:35

Your Answer

By clicking “Post Your Answer”, you agree to our terms of service and acknowledge you have read our privacy policy.

Not the answer you're looking for? Browse other questions tagged or ask your own question.