3
$\begingroup$

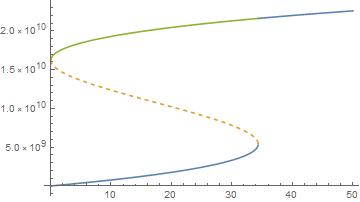
enter image description here

I want to run the y-coordinates of this graph through a set of inequalities and store only those values which satisfy them. I thought of using For loop with TrueQ but the y co-ordinates have three solutions corresponding to a particular x. I did not get how to run these three values and for each x. May anyone please guide?

g1 = 430 *Pi;
h = (6.63/(2*Pi))*10^-34;
k = 2*10^6*Pi;
wm = 2*10^7 *Pi;
d = 2.7*wm;
wp = 2*Pi*3.14*10^14; 

eqn=y (d^2+k^2)-(2 d g1^2 y^2)/wm+(g1^4 y^3)/wm^2==(2 k x)/(h wp)//Simplify;
solR = Solve[eqn, y, Reals];
y1 = Evaluate[y /. solR];
plt = Plot[Evaluate[y /. solR], {x, 0, 3}, 
  WorkingPrecision -> Automatic, PlotStyle -> {Automatic, Dashed}]

r = y1 /. Undefined -> 0;
result = Nothing;
For[x = 0.42, x < 2, x = x + 0.01, i = 1; 
 For[i = 1, i < 4, i++, 
  s1 = k^2 + (d - ((g1^2)*r[[i]]/wm))^2 + 2*k*gm + wm^2; 
  s2 = (k^2 + (d - ((g1^2)*r[[i]]/wm))^2)*gm + 2*k*wm^2; 
  s3 = (k^2 + (d - ((g1^2)*r[[i]]/wm))^2)*(wm^2) - (d - (g1^2*
         r[[i]]/wm))*wm*(g1^2)*(2*r[[i]]); 
  If[s1 > 0 \[And] s2 > 0 \[And] 
    s3 > 0 \[And] ((2 k + gm) s1 > s2) \[And] (s1*s2 (2 k + gm) > 
      s2^2 + (2 k + gm)^2*(s3)), 
   result = Level[{result, {x, r[[i]]}}, {-2}]; Print[r[[i]]], 
   Continue[]]]]

Given Below are inequalities:

 s1=k^2+(d-((g1^2)*y1/wm))^2+2*k*gm+wm^2;
s2=(k^2+(d-((g1^2)*y1/wm))^2)*gm+2*k*wm^2;
s3=(k^2+(d-((g1^2)*y1/wm))^2)*(wm^2)-(d-(g1^2*y1/wm))*wm*(g1^2)*(2y1);
(2k+gm)s1>s2;
s1*s2(2k+gm)>s2^2+(2k+gm)^2*(s3);
$\endgroup$

2 Answers 2

4
$\begingroup$
Clear["Global`*"]

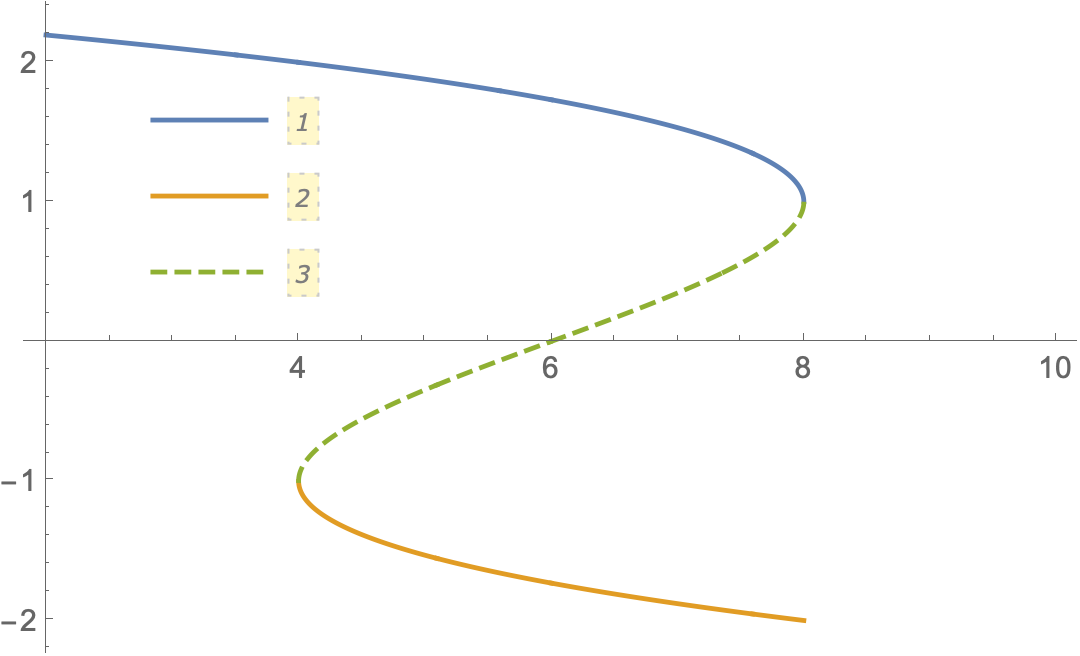
sol = Solve[x == -y^3 + 3 y + 6, y, Reals] // ToRadicals // FullSimplify;

plt = Plot[Evaluate[y /. sol], {x, 2, 10},
  PlotStyle -> {Automatic, Automatic, Dashed},
  PlotPoints -> 500,
  MaxRecursion -> 5,
  Exclusions -> All,
  PlotLegends -> Placed[Automatic, {.2, .7}]]

enter image description here

allPts = Cases[plt, Line[pts_] :> pts, Infinity] // Flatten[#, 1] &;

Use Select to pick out points using inequalities

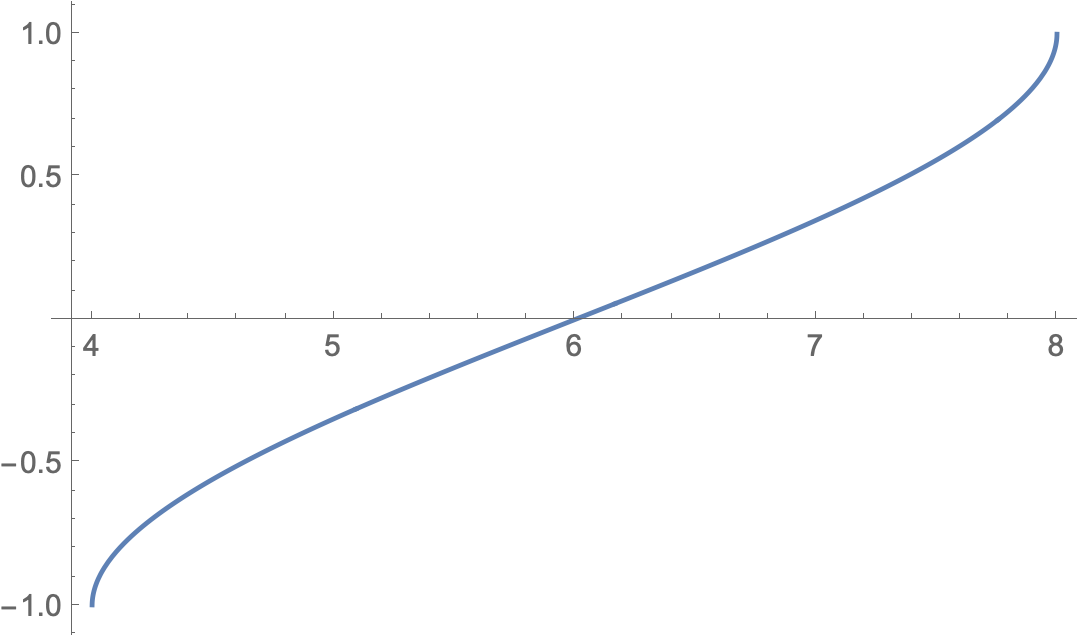
selPts = Sort@Select[allPts, 4 < #[[1]] < 8 && -1 < #[[2]] < 1 &];

Or Cases

selPts == Sort@
  Cases[allPts, _List?(4 < #[[1]] < 8 && -1 < #[[2]] < 1 &), Infinity]

(* True *)

ListLinePlot[selPts]

enter image description here

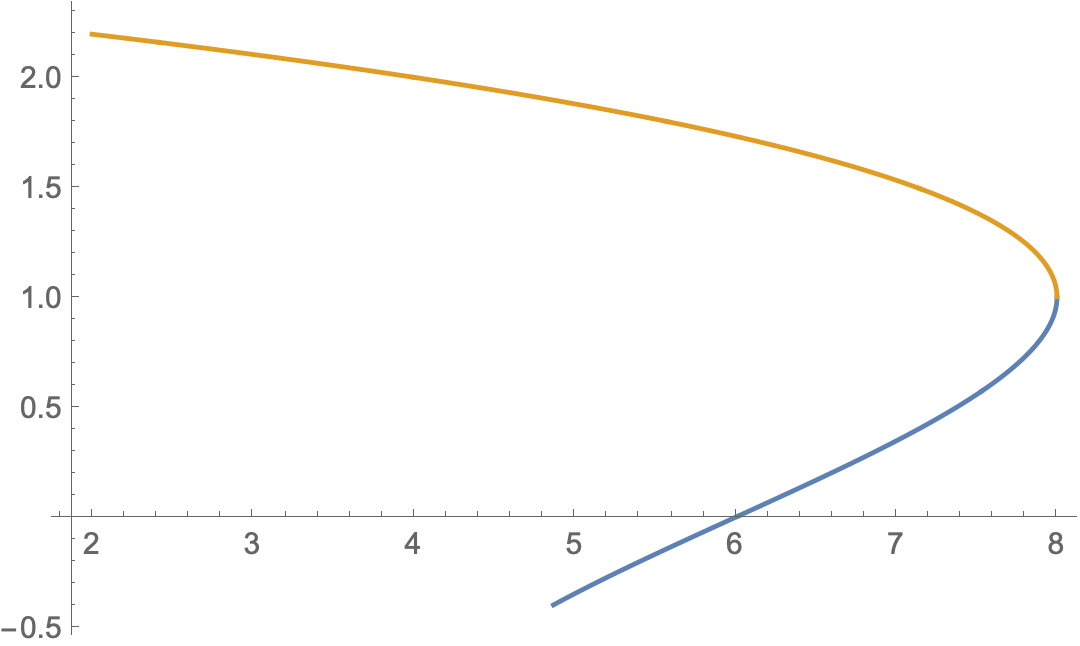
EDIT: For the revised selection criteria

selPts2 = SortBy[
   Select[allPts, 
    5 #[[2]] + 2 > 0 && 8 #[[2]]^2 + 7 > 0 && 9 #[[2]]^3 + 1 > 0 &], Last];

ListLinePlot[GatherBy[selPts2, #[[2]] >= 1 &]]

enter image description here

$\endgroup$
2
  • $\begingroup$ s1=5*y+2>0; s2=8*y^2+7>0; s3=9*y^3+1>0. Could you use these inequalities in your answer ? Also I have to check these inequalities for all three y corresponding to a single x. $\endgroup$
    – Lost
    Commented Sep 23, 2020 at 0:52
  • $\begingroup$ I added use of the revised criteria as I understand them. $\endgroup$
    – Bob Hanlon
    Commented Sep 23, 2020 at 1:33
2
$\begingroup$

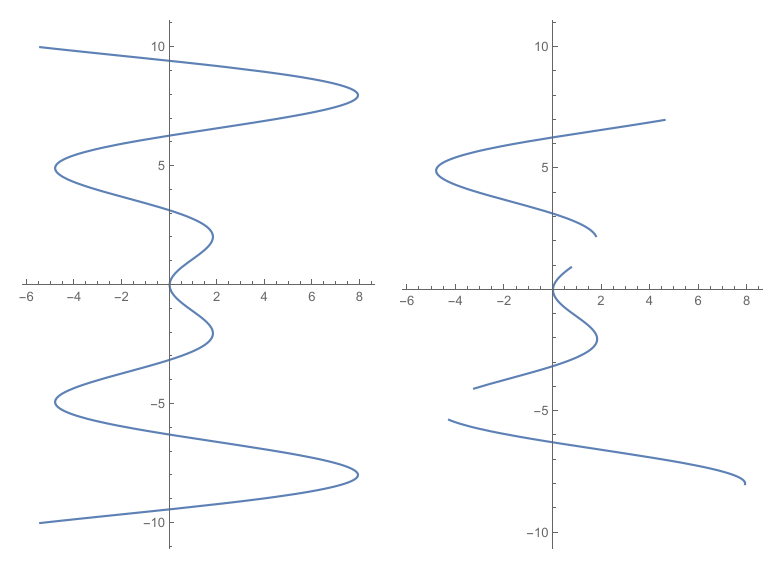
Maybe RegionFunction suitable your request.

BTW,where is your equation and inequalities?

Clear["`*"];
a = ParametricPlot[{x, y} /. x -> Sin[y]*y, {y, -10, 10}];
b = ParametricPlot[{x, y} /. x -> Sin[y]*y, {y, -10, 10}, 
   RegionFunction -> 
    Function[{x, y}, And @@ {y > -8, y < 7, Sin[y] < .8}]];
GraphicsRow[{a, b}]

enter image description here

$\endgroup$

Your Answer

By clicking “Post Your Answer”, you agree to our terms of service and acknowledge you have read our privacy policy.

Not the answer you're looking for? Browse other questions tagged or ask your own question.