I have a set of points
Ainput = {{0., 0.}, {0.14, 0.049}, {0.27, 0.098}, {0.38, 0.14}, {0.47,
     0.19}, {0.56, 0.23}, {0.63, 0.28}, {0.69, 0.32}, {0.74,
    0.36}, {0.78, 0.4}, {0.81, 0.44}, {0.83, 0.47}, {0.85,
    0.51}, {0.86, 0.54}, {0.86, 0.58}, {0.86, 0.61}, {0.85,
    0.64}, {0.84, 0.67}, {0.83, 0.7}, {0.81, 0.72}, {0.79,
    0.75}, {0.77, 0.77}, {0.74, 0.8}, {0.72, 0.82}, {0.69,
    0.84}, {0.66, 0.86}, {0.63, 0.88}, {0.61, 0.89}, {0.58,
    0.91}, {0.56, 0.92}, {0.53, 0.94}, {0.51, 0.95}, {0.49,
    0.96}, {0.47, 0.97}, {0.46, 0.98}, {0.44, 0.98}, {0.43,
    0.99}, {0.42, 0.99}, {0.41, 1.}, {0.42, 0.99}, {0.43,
    0.99}, {0.44, 0.98}, {0.46, 0.98}, {0.47, 0.97}, {0.49,
    0.96}, {0.51, 0.95}, {0.53, 0.94}, {0.56, 0.92}, {0.58,
    0.91}, {0.61, 0.89}, {0.63, 0.88}, {0.66, 0.86}, {0.69,
    0.84}, {0.72, 0.82}, {0.74, 0.8}, {0.77, 0.77}, {0.79,
    0.75}, {0.81, 0.72}, {0.83, 0.7}, {0.84, 0.67}, {0.85,
    0.64}, {0.86, 0.61}, {0.86, 0.58}, {0.86, 0.54}, {0.85,
    0.51}, {0.83, 0.47}, {0.81, 0.44}, {0.78, 0.4}, {0.74,
    0.36}, {0.69, 0.32}, {0.63, 0.28}, {0.56, 0.23}, {0.47,
    0.19}, {0.38, 0.14}, {0.27, 0.097}, {0.14, 0.049}, {0., 0.}};
Then i use plot
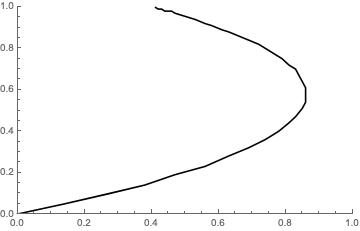
ListLinePlot[Ainput, PlotRange -> {{0, 1}, {0, 1}}, PlotStyle -> Black]
And as you can see, this is not a function. But i want to find a way how to delete the points (or lines) to have a function from these points. So in case there are lines above each other (or points) I always want to keep the one with a higher function value.
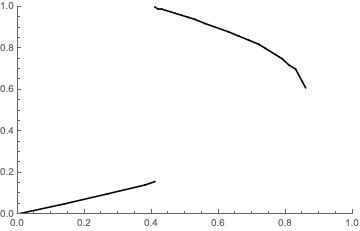
I would like to get exactly this what you can see on this picture
Any ideas how could I do it? Thank you for any advices.


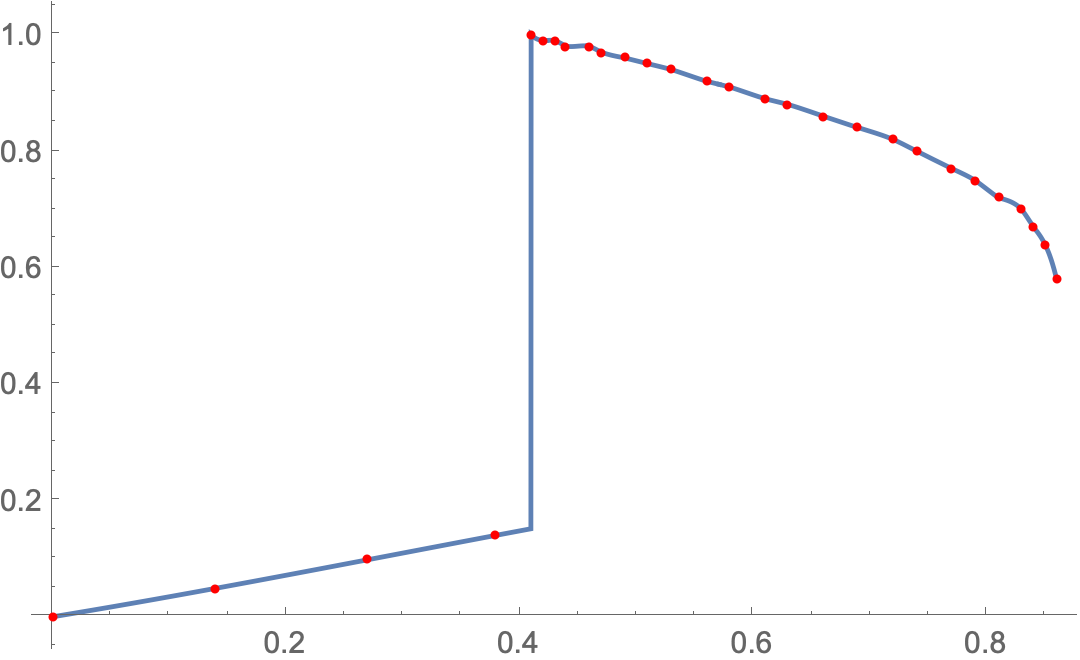
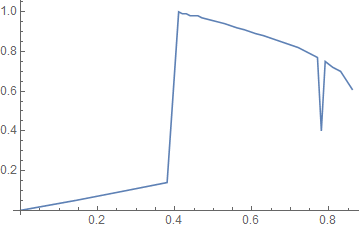
ListLinePlot[ Sort[Map[First@MaximalBy[#, Last] &, GatherBy[Ainput, First]]]], but it's very ugly code. $\endgroup$