9
$\begingroup$

I'd like to fill a curve in a ParametricPlot3D in the same way as I might with ListPointPlot3D; i.e.,

ListPointPlot3D[data, ColorFunction -> "Rainbow", Filling -> Bottom]

I obtained the data numerically, point-by-point, with MATLAB. I have found a parametric expression for $y$ ($y = f(x)$) and I have a function $F(x, y, z)$, but I want to plot $F$ only for the curve $y = f(x)$, i.e., the 3D surface is defined as

Plot3D[x^2 Sin[x] + y^2 Cos[y] - x y, {x, 0, 1}, {y, 0, 1}]

and I want to plot only the specific line of surface which satisfy $y = f(x) = x^2$ using

ParametricPlot3D[{x, x^2, x^2 Sin[x] + y^2 Cos[y] - x y /. y -> x^2}, {x, 0, 1}]

I'd like to add a filling, but I don't know how. When I type Filling ->, the Mathematica code editor complains (the text becomes red).

$\endgroup$

4 Answers 4

9
$\begingroup$

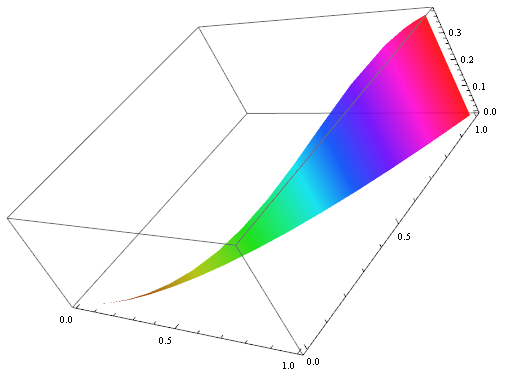
Why don't you just use ListPointPlot3D

ListPointPlot3D[
 Table[{x, x^2, x^2 Sin[x] + y^2 Cos[y] - x y /. y -> x^2}, {x, 0, 1, 
   0.001}], ColorFunction -> "Rainbow", Filling -> Bottom]

enter image description here

$\endgroup$
9
$\begingroup$

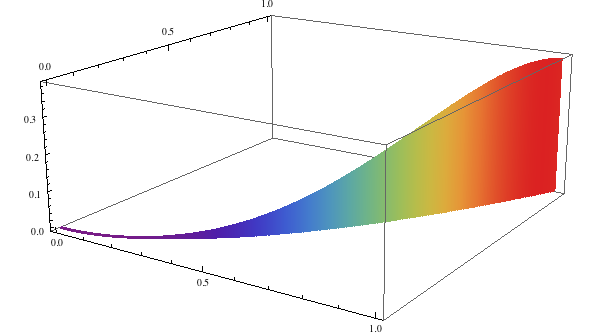
You can use the two-parameter version of ParametricPlot3D:

  ParametricPlot3D[{x, x^2, v ( x^2 Sin[x] + (x^4) Cos[x^2] - x^3)}, {x, 0, 1}, {v, 0, 1},
   Mesh -> None, PlotStyle -> Opacity[.9], ColorFunction -> (Hue[#2] &)]

enter image description here

$\endgroup$
4
$\begingroup$

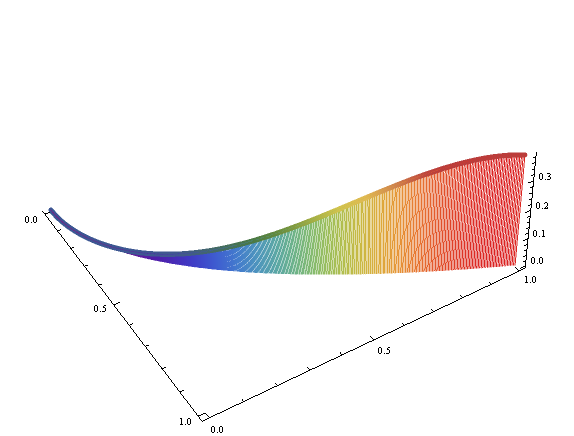
Using Show is definitely one option to achieve what you want.

Show[ParametricPlot3D[{x, x^2,x^2 Sin[x] + y^2 Cos[y] - x y /. y -> x^2}, {x, 0, 1}, 
       Mesh -> False, 
       ColorFunction -> "DarkRainbow",
       PlotStyle -> Directive[Thick, Opacity[.8]]], 
     ListPointPlot3D[Table[{x, x^2, x^2 Sin[x] + y^2 Cos[y] - x y /. y -> x^2},
       {x, 0, 1, .002}], 
       PlotStyle -> PointSize[Tiny], 
       ColorFunction -> "Rainbow",
       Filling -> Bottom],
       Boxed -> False]

enter image description here

BR

$\endgroup$
3
$\begingroup$

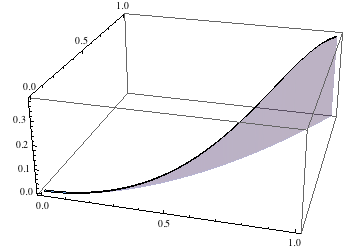
You could fake a parametric plot if you want to keep the Filling functionality by using a RegionFunction that constrains y to "something close" to x^2:

Plot3D[x^2 Sin[x] + y^2 Cos[y] - x y, {x, 0, 1}, {y, 0, 1}, 
 RegionFunction -> Function[{x, y, z}, x^2 < y < x^2 + .01], 
 PlotPoints -> 80,  
 Filling -> Axis, 
 FillingStyle -> Automatic]

Mathematica graphics

you may want to tweak the threshold 0.01 in the RegionFunction, to scale with the PlotPoints. The way it is now defined, it will look poor for less PlotPoints. This is quite an inelegant solution compared to the suggestion to plot filling and curve separately.

$\endgroup$
1
  • $\begingroup$ I used $x-0.005 < y < x+0.005$ for a similar display. $\endgroup$
    – Carl
    Commented Feb 11, 2018 at 15:04

Your Answer

By clicking “Post Your Answer”, you agree to our terms of service and acknowledge you have read our privacy policy.

Not the answer you're looking for? Browse other questions tagged or ask your own question.