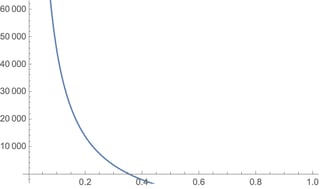
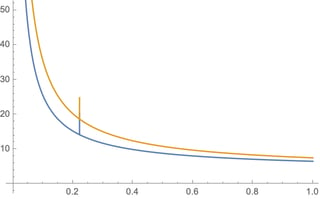
I am using a compartment model from this paper.
I am trying to recreate Figure 6. I will be honest, I have no clue how to approach this. The paper doesn't give information on how to achieve the figure, but I would love to understand and know how it is made.
The following parameters and System are being used in Mathematica:
L = 2000; (* Maximum queen daily laying rate*)
w = 27000; (* Rate at which eclosion approaches L as N gets large*)
alpha = 0.25; (*maximum rate that hive bees will become foragers when there are no foragers in the colony*)
sigma = 3/4; (*social inhibition factor*)
m = 0.24; (*die-off rate forager bees*)

T = 10000;
sol = NDSolve[{
    H'[t] == L*(H[t] + F[t])/(w + H[t] + F[t]) -H[t]*(alpha - sigma*(F[t]/(H[t] + F[t]))),
    F'[t] == H[t]*(alpha - sigma*(F[t]/(H[t] + F[t]))) - m*F[t],
    {H[0], F[0]} == {300, 250}}, {H, F}, {t, 0, T}, MaxSteps -> Infinity];
Steady state
N[#] & /@ Solve[{
    0 == L*(H + F)/(w + H + F) - H*(alpha - sigma*(F/(H + F))),
    0 == H*(alpha - sigma*(F/(H + F))) - m*F}, {H, F}] // Simplify


NSolverather thanSolve, and remove theNandSimplifyfrom the steady-state calculation. However, the problem is outside of Mathematica; namely, how do the solutions you get relate to the plot they show? That requires discipline-specific knowledge and context that you, unfortunately, did not provide. Unless you find a fellow entomologist with the necessary knowledge in this forum, I'm afraid you will have to provide a lot more information. $\endgroup$Plot[{Evaluate[H[t] /. sol], Evaluate[F[t] /. sol]}, {t, 0, T}, PlotRange -> {{0, 40}, {0, 12000}}, Frame -> True, FrameLabel -> {Style["Time", 16], Style["Population fractions", 14]}, PlotStyle -> {Blue, Red}, PlotLegends -> SwatchLegend[{"H", "F"}], ImageSize -> 250]$\endgroup$