1
$\begingroup$

following this question of mine Conditional PlotStyle, I ran into another problem.

I fear it has to do with evaluation orders, as for example described in Table and Evaluation Order, but I am totally unable to understand the subtlety.

Even recreating a minimum working example proved trickie. The following is sufficient to trigger a problem (although not exactly the same I witness, I hope the roots are the same).

A function is defined

  f2[x_, y_] := x^2 - y

and another two, the first using using FindMinimum

 g[y_] := FindMinimum[f2[x, y], x]

 f3[z_, n_] := g[z/n][[1]]

Now if I use

  Plot[Table[f3[z, n], {n, 1, 10}], {z, 0, 0.3}]

everything runs fine.

Yet, if I do

   Plot[Evaluate@Table[f3[z, n], {n, 1, 10}], {z, 0, 0.3}]

I get minimisation errors. In my original case I do get a plot, albeit a wrong one, compared to the correct results I get before using Evaluate.

Thanks

$\endgroup$
0

1 Answer 1

3
$\begingroup$

Change the definitions to

f2[x_?NumericQ, y_?NumericQ] := x^2 - y;
g[y_?NumericQ] := FindMinimum[f2[x, y], x][[1]]
f3[z_?NumericQ, n_?NumericQ] := g[z/n];

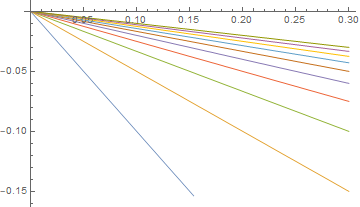
Now it works

  Plot[Evaluate@Table[f3[z, n], {n, 1, 10}], {z, 0, 0.3}]

Mathematica graphics

This makes it "see" these functions with numerical arguments only, not symbolic, and hence these functions are called when the arguments has been bounded to the numerical values, and not before.

$\endgroup$
2
  • 1
    $\begingroup$ One further modification I would do is to use FindMinValue[] in defining g. $\endgroup$ Commented May 16, 2020 at 23:51
  • $\begingroup$ @J.M. good idea. I did not want to modify the OP code itself now too much, since the issue was just the plotting problem. Just changed it to make the plot works. $\endgroup$
    – Nasser
    Commented May 16, 2020 at 23:53

Your Answer

By clicking “Post Your Answer”, you agree to our terms of service and acknowledge you have read our privacy policy.

Not the answer you're looking for? Browse other questions tagged or ask your own question.