SeedRandom[1]
data = RandomVariate[BinormalDistribution[.5], 10];
pdf = PDF[SmoothKernelDistribution[data]];

sdh = SmoothDensityHistogram[data, MeshStyle -> Red, Mesh -> 3,
   Method -> {"BoundaryOffset" -> False},
   PlotLegends -> Placed[BarLegend[Automatic,
      LabelStyle -> {GrayLevel[0.3], 30, FontFamily -> "Arial"}], After]];
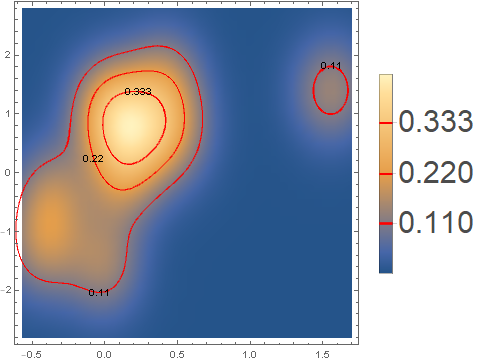
Extract the mesh lines from sdh and find the associated pdf values:
mesh = DeleteDuplicates @ Round[Cases[Normal@sdh, Line[x_] :> pdf[x[[1]]], All], .001];
Post-process sdh to inject the (undocumented) sub-option "StyledContours" into the legend:
styledcontours = Method -> "StyledContours" -> Thread[{mesh, Directive[Thick, Red]}];

sdh /. b_BarLegend :> Append[b, styledcontours]
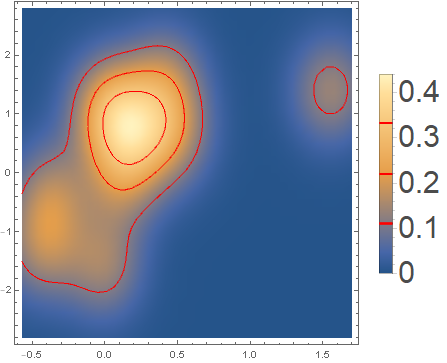
To add text labels to the mesh lines using another round of post-processing:
epilog = Cases[Normal @ sdh, Line[x_] :>
    Text[ Round[pdf[x[[1]]], .001], BSplineFunction[x]@.5], All];

Show[sdh /. b_BarLegend :> Append[b, styledcontours], Epilog -> epilog]
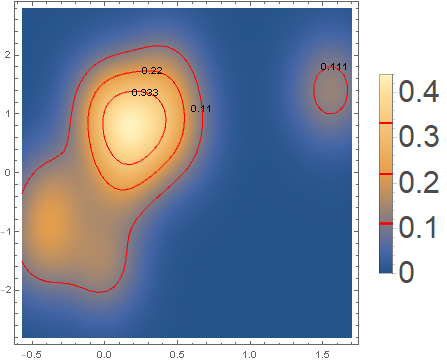
Alternatively, we can construct a ContourPlot using mesh as Contours and the option ContourLabels and Show it with sdh:
cp = ContourPlot[pdf[{x, y}],, {x, -1, 2}, {y, -3, 3},
   Contours -> DeleteDuplicatesBy[Round[#, .01] &]@mesh,
   ContourStyle -> Red, ContourLabels -> All, ContourShading -> None,
   PlotRange -> All];

Show[sdh /. b_BarLegend :> Append[b, styledcontours], cp]
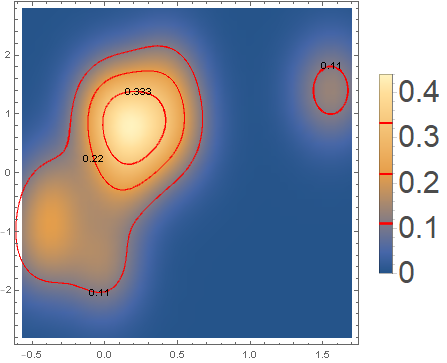
You can also change the list of labeled ticks in BarLegend using
Show[sdh /. b_BarLegend :> Append[b, {styledcontours,
     "Ticks" -> DeleteDuplicatesBy[Round[#, .01] &]@mesh}],
  cp]
