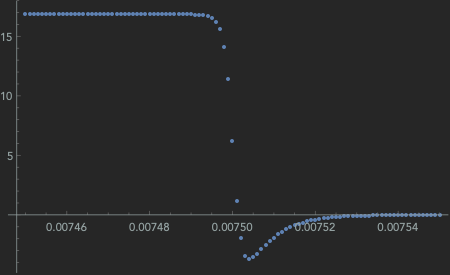
Apologies if this question is repetitive, but I have browsed the questions already posed on exporting data from NDSolve and haven't been able to successfully apply the information I found to my own needs. Given the specified boundary conditions for phi, I have used NDSolve to solve a PDE for the profile within the domain. I then used the results of the NDSolve in another equation, and it is the results of this equation that I would like to export. Basically, I am looking to export the values that I plotted in the code below. I attempted to create a table of the them, but what has ended up in the table is the input i.e. 'Ienum[7.5*10^-6,1/10000]' not the evaluation of Ienum at those coordinates. Below is the code I've developed; the relevant part is at the end, before then is just setting up the problem. If anyone has suggestions on how to put the results of Ienum into a table or can point me to a more helpful answer than those I've already viewed, that would be great!
(*Constants used in subsequent equations*)
e = 1.60217662*10^-19;
l = 10*10^-6;
sige = 3.37*10^-5;
phi1 = 0;
phi2 = -5;
x1 = 0;
x2 = l;
y1 = 0;
y2 = 0.0025;
y3 = 0.0075;
y4 = 0.01;
(*Boundary conditions*)
bcphi = {DirichletCondition[
    phi[x, y] == phi1, (x == x1 && y1 < y < y4)],
   DirichletCondition[phi[x, y] == phi2, (x == x2 && y2 < y < y3)]};
(*Create mesh*)
meshRefine[vertices_, area_] := area > 10^-12;
mesh = ToElementMesh[
   DiscretizeRegion[ImplicitRegion[True, {{x, x1, x2}, {y, y1, y4}}]],
    MeshRefinementFunction -> meshRefine];
(*Solve for phi everywhere*)
solphi = NDSolve[{Laplacian[phi[x, y], {x, y}] ==
     0 + NeumannValue[0,
       y == y1 ||
        y == y4 || (x == x2 && y1 <= y <= y2) || (x == x2 &&
          y3 <= y <= y4)], bcphi}, phi, {x, y} \[Element] mesh];
(*Use the results of NDSolve in second equation*)
Ienum[x, y] = -sige*(D[phi[x, y] /. solphi, x] +
     D[phi[x, y] /. solphi, y]);
(*Plot results*)
Plot[Ienum[x, y] /. x -> 0.0000075, {y, y3 - 0.00005, y3 + 0.00005}]
(*Export data*)
Iedata = Table[
   Flatten[{y, Evaluate[{Ienum[x, y] /. x -> 0.0000075}]}], {y,
     y3 - 0.00005, y3 + 0.00005, 10^-6}];
Export["Ie_data.csv", Iedata];

