For example, I've got the following code:
Plot[{x >= 5, y >= 8, x + 2y <= 64, x + y <= 40}]
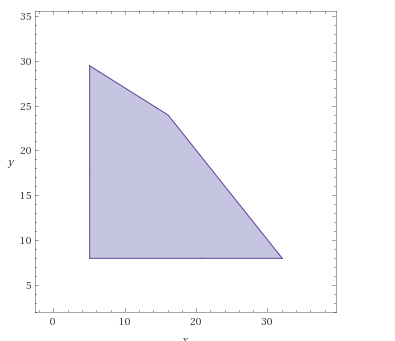
This would plot:
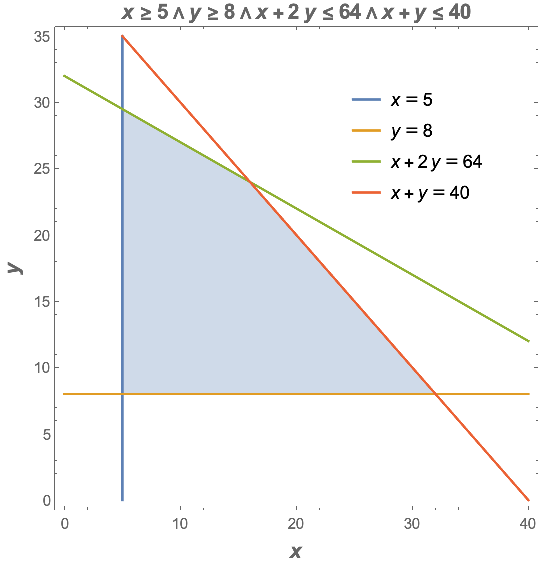
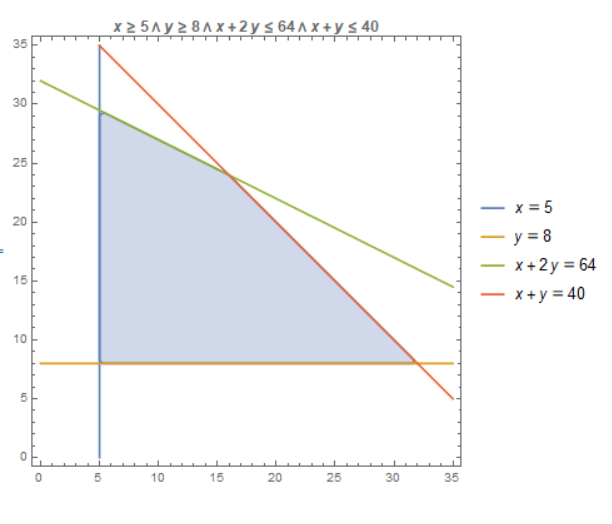
Now, this is fair enough. It shows me the graphical solution of my four inequalities, however, I also would like to have the lines of those inequalities to be plot as well alongside the graphical solution of my inequalities. How would I do that?


