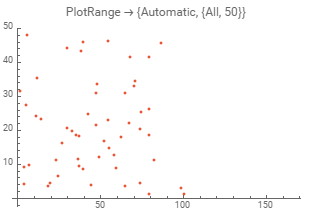
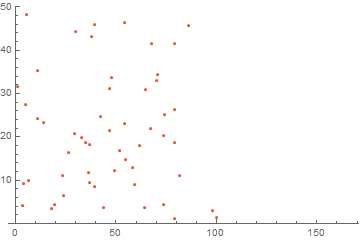
Is there any easy way to manually set only one side of the plot range and let the other one be set by either the automatic value or the max value (either option would be acceptable, which ever one is easier)? So I would like to specify something like
ListPlot[data,PlotRange->{Automatic,{1,max}}]
To alter the y plot range to {1,max value in data}. I know I can find this value max by hand for each plot, but since I use this kind of option often I would like to avoid having a separate line for this each time.


