2
$\begingroup$

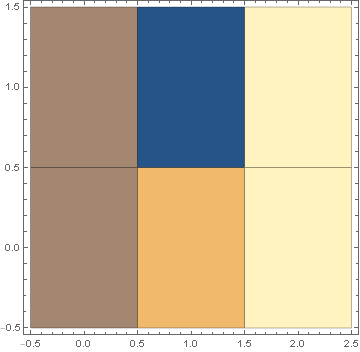
When plotting data with ListDensityPlot, 'empty' points in a grid are interpolated, even when InterpolationOrder is set to zero. This gives awkward triangular shapes, and implies that information exists for that part of the graph, as around x=1,y=1 below.

Data = {{0, 0, 1}, {0, 1, 1}, {1, 0, 2}, {2, 0, 3}, {2, 1, 3}};
ListDensityPlot[Data, InterpolationOrder -> 0, Mesh -> All, PlotRange -> {{-0.5, 2.5}, {-0.5, 1.5}}]

enter image description here

Is there a way to show blank space instead?

Of course it is possible to just add zeroes wherever there are empty tiles (example below), but this is hacky and would require quite some effort for patchy data files.

Data2 = {{0, 0, 1}, {0, 1, 1}, {1, 0, 2}, {1, 1, 0}, {2, 0, 3}, {2, 1, 3}};
ListDensityPlot[Data2, InterpolationOrder -> 0, Mesh -> All, PlotRange -> {{-0.5, 2.5}, {-0.5, 1.5}}]

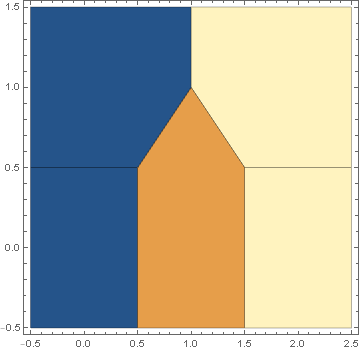
enter image description here

$\endgroup$
1
  • $\begingroup$ Zero is a perfectly valid data value, and as such you can't expect it to be taken as missing data. I don't know if it will give you what you want, but you might try Null. $\endgroup$
    – Bill Watts
    Commented Jul 11, 2019 at 21:09

1 Answer 1

1
$\begingroup$

If the row and column values are integers in your data, the most convenient way to insert zeros for non-existent row/column combinations is to transform your input data into a SparseArray:

ClearAll[toSparseArray, dataRange]

toSparseArray = SparseArray[{#2, #} + 1 -> #3 & @@@ #, 
         1 + Max /@ Transpose[#[[All, {2, 1}]] + 1]] &;

dataRange = {-.5, .5} + # & /@ Reverse[MinMax /@ 
    Transpose@toSparseArray[#]["NonzeroPositions"] - 1] &;

Examples:

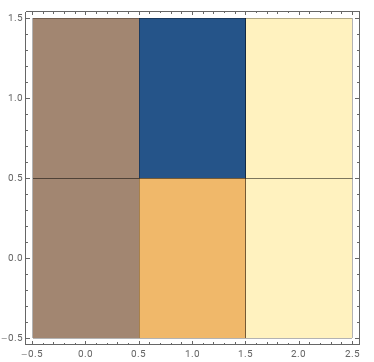
ListDensityPlot[toSparseArray @ Data, 
 InterpolationOrder -> 0, Mesh -> All, DataRange -> dataRange @ Data]

enter image description here

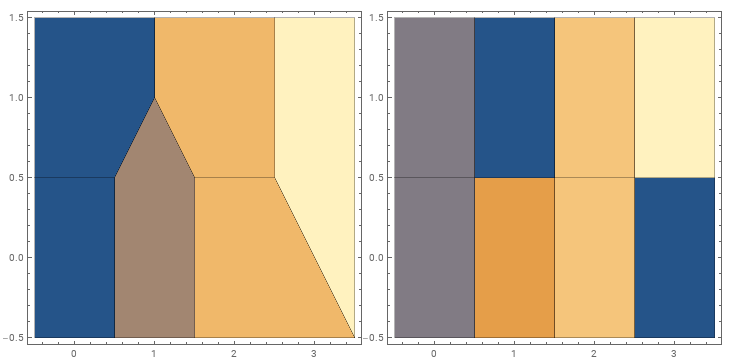
Data3 = {{0, 0, 1}, {0, 1, 1}, {1, 0, 2}, {2, 0, 3}, {2, 1, 3}, {3, 1,  4}};

Row @ {ListDensityPlot[Data3, InterpolationOrder -> 0, Mesh -> All, 
     PlotRange -> {{-0.5, 3.5}, {-0.5, 1.5}}, ImageSize -> Medium], 
  ListDensityPlot[toSparseArray @ Data3, InterpolationOrder -> 0, 
     Mesh -> All, DataRange -> dataRange @ Data3, ImageSize -> Medium]}

enter image description here

$\endgroup$

Your Answer

By clicking “Post Your Answer”, you agree to our terms of service and acknowledge you have read our privacy policy.

Not the answer you're looking for? Browse other questions tagged or ask your own question.