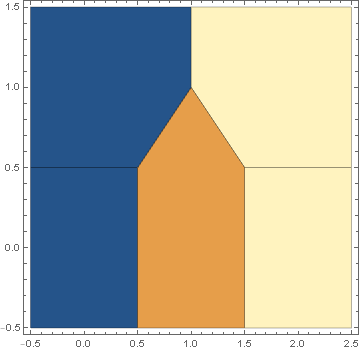
When plotting data with ListDensityPlot, 'empty' points in a grid are interpolated, even when InterpolationOrder is set to zero. This gives awkward triangular shapes, and implies that information exists for that part of the graph, as around x=1,y=1 below.
Data = {{0, 0, 1}, {0, 1, 1}, {1, 0, 2}, {2, 0, 3}, {2, 1, 3}};
ListDensityPlot[Data, InterpolationOrder -> 0, Mesh -> All, PlotRange -> {{-0.5, 2.5}, {-0.5, 1.5}}]
Is there a way to show blank space instead?
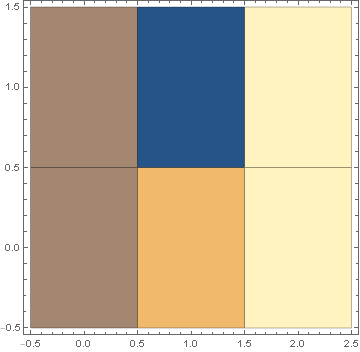
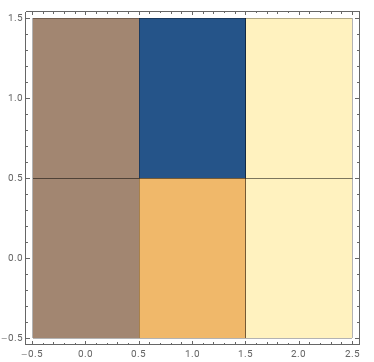
Of course it is possible to just add zeroes wherever there are empty tiles (example below), but this is hacky and would require quite some effort for patchy data files.
Data2 = {{0, 0, 1}, {0, 1, 1}, {1, 0, 2}, {1, 1, 0}, {2, 0, 3}, {2, 1, 3}};
ListDensityPlot[Data2, InterpolationOrder -> 0, Mesh -> All, PlotRange -> {{-0.5, 2.5}, {-0.5, 1.5}}]


Null. $\endgroup$