0
$\begingroup$

I have the following simple coordinate, which I am trying to plot:

xy = {0, 0.963738}

I am trying:

ListPlot[xy, Joined -> False, PlotRange -> {{0, 10}, {0.5, 1}}, PlotStyle ->{Thick}, PlotLabels -> Placed[{"Isolated"}, {Scaled[1], After}]]

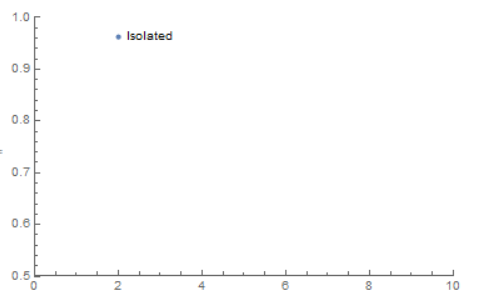
Why is the outcome (note x=2 and not 0 as I expected):

enter image description here

$\endgroup$
2
  • 1
    $\begingroup$ ListPlot always expects a list of points, not just a point. xy = {{0, 0.963738}} would be a single point: a list of points containing only one element, which is itself a list of two coordinates. If you want to add a single point to another plot, you may also consider the Epilog option. $\endgroup$
    – Roman
    Commented Jun 3, 2019 at 9:30
  • $\begingroup$ If you call ListPlot with a single list of values MMA plotsthe listindex as x-value! $\endgroup$ Commented Jun 3, 2019 at 10:14

1 Answer 1

3
$\begingroup$
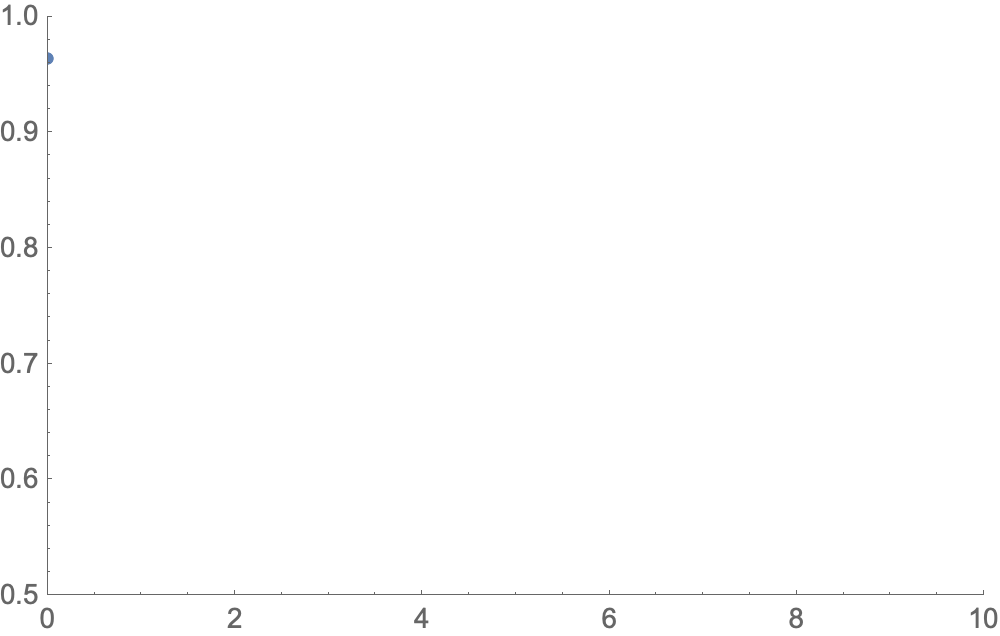
xy = {{0, 0.963738}};
P = ListPlot[xy, PlotRange -> {{0, 10}, {0.5, 1}}, PlotStyle -> Thick]

enter image description here

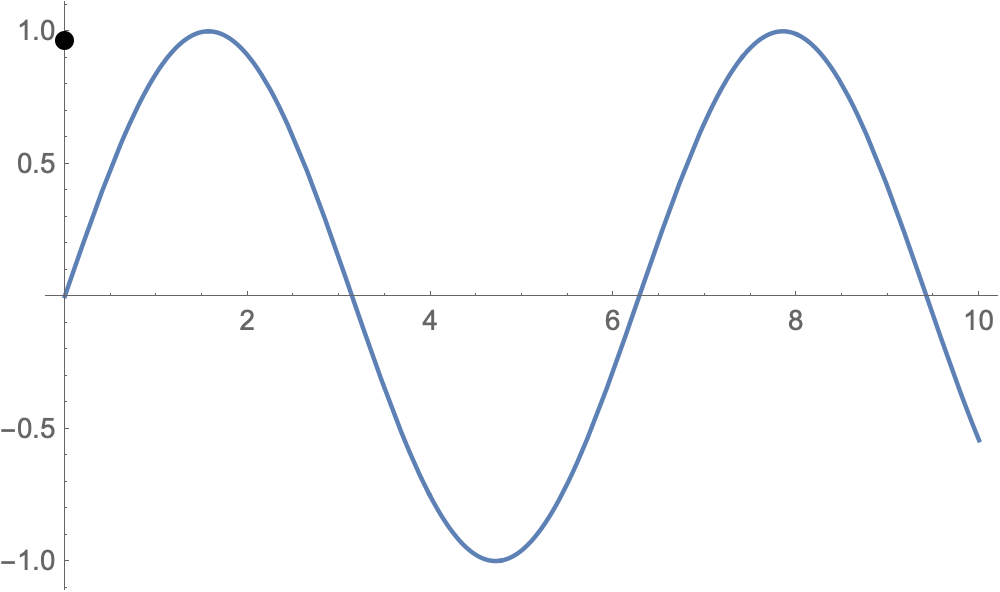
Or use Epilog:

Plot[Sin[x], {x, 0, 10}, Epilog -> {PointSize[0.02], Point /@ xy}]

enter image description here

$\endgroup$

Your Answer

By clicking “Post Your Answer”, you agree to our terms of service and acknowledge you have read our privacy policy.

Not the answer you're looking for? Browse other questions tagged or ask your own question.