I am trying to do the following:
I have a simple 2x2 matrix that depends on three parameters (physically -- momentum coordinates kx, ky, kz). Then I want to replace each of these parameters by a matrix block of size "cut x cut" (physically -- Peirels substitutaion with a cut-off). The results is a "2*cut x 2*cut" matrix. I want to study eigenvalues of this matrix.
Let me show how I implement this, step by step, in my code. The problem is that in the end I get wrong results, and I don't understand why.
First, I define the small matrix that depends on three parameters. For example (although in general I also have powers of kx,ky,kz):
H[kx_,ky_,kz_]:=kx*PauliMatrix[1]+ky*PauliMatrix[2]+kz*PauliMatrix[3];
Next, I know I will replace parameters kx, ky, kz (and potentially also their powers) by some matrix blocks. I define these blocks as follows:
a[cut_] := Module[
   {c = cut, t},
   t = ConstantArray[0, {c, c}];
   Do[t[[i, i + 1]] = Sqrt[i], {i, 1, c - 1}];
   t
   ];

aDag[cut_] := ConjugateTranspose[a[cut]];

eye[cut_] := IdentityMatrix[cut];
Now I substitute the parameters kx,ky,kz by the blocks defined above:
HLLz[kz_, cut_] :=
  ArrayFlatten[
   H[kx, ky, kz] /. {kx -> (a[cut] + aDag[cut])/Sqrt[2],
     ky -> I*(a[cut] - aDag[cut])/Sqrt[2],
     kz -> kz*IdentityMatrix[cut]}];
For example,
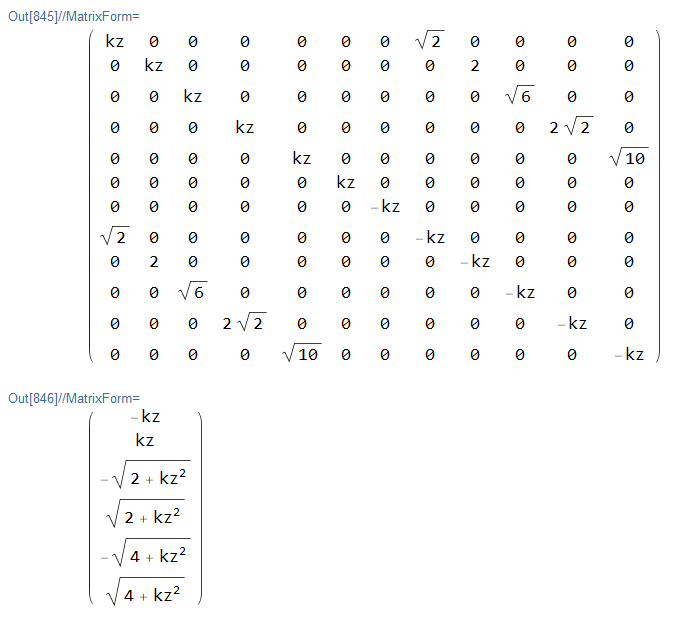
HLLz[kz, 6] // MatrixForm
Eigenvalues[HLLz[kz, 3]] // MatrixForm
correctly output
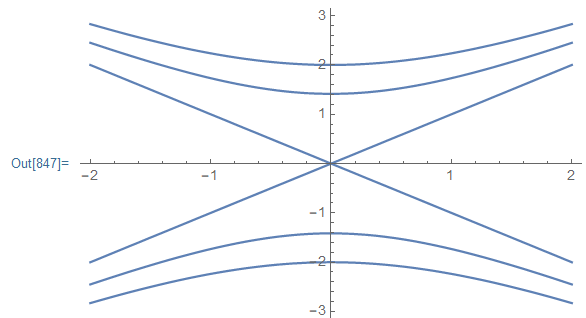
These eigenvalues can be plotted as a function of kz
Plot[Sort[{-kz, kz, -Sqrt[2 + kz^2], Sqrt[2 + kz^2], -Sqrt[4 + kz^2],
   Sqrt[4 + kz^2]}, Greater], {kz, -2, 2}]
Leading again to a correct output
However, when I calculate the eigenvalues and plot them in one step (for example when I want to apply this calculations to more complicated models which do not have analytic solution for eigenvalues), I get something wrong. This piece of code:
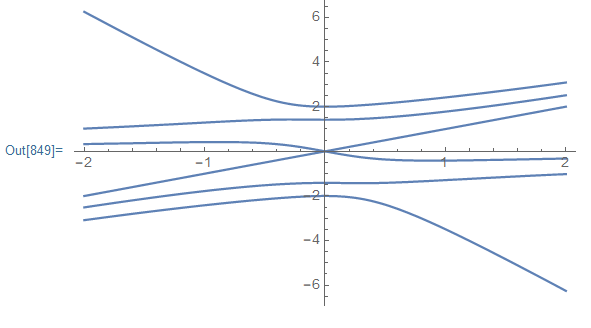
Plot[Sort[Eigenvalues[HLLz[kz, 3]], Greater], {kz, -2, 2}]
outputs the following different and wrong plot of eigenvalues:
Could anybody explain to me why the two pieces of code yield different plots? How do I correct the latter piece of code where I calculate the eigenvalues and plot them in a single cell/step?


HLLzwith a numerical input: evaluateEigenvalues[HLLz[0.1, 3]]andEigenvalues[HLLz[kz, 3]] /. kz -> 0.1. $\endgroup$HLLz[kz_, cut_], useHLLz[kzp_, cut_]instead and modifykz -> kz*IdentityMatrix[cut]tokz -> kzp*IdentityMatrix[cut]. It's hard to trace out exactly what is happening, but by using the same symbol there and plugging in numbers before the replacement happens, the final (numerical) matrix is wrong, and so the eigenvalues are wrong. $\endgroup$