0
$\begingroup$

Im trying to animate multiple points around multiple parametric plots which depicts orbital motion of body around a planet. Initial conditons are;

μ = 3.986004418*10^14
a = {7.92597218162462`*^6, 7.359004757830201`*^6, 
  6.970300551929753`*^6}
r = {7.388961739897817`*^6, 7.352270990873303`*^6, 
  6.989358622500435`*^6}
v = {7589.490674834727`, 7366.424498576473`,7541.464522475139`}
Ecc = {0.014, 0.025, 0.03}(*eccentricity*)
RAAN = {150, 160, 170}
Inc = {20, 80, 320}
ArgPer = {220, 110, 330}

The following parametric equations are

Table[{x[t] = 
   a[[i]] (1 - Ecc[[i]]^2)/(1 + Ecc[[i]]*Cos[t])*Cos[t],{y[t] = 
   a[[i]] (1 - Ecc[[i]]^2)/(1 + Ecc[[i]]*Cos[t])*Sin[t]}}, {i, 1, 3}]

which are used in NDSolve

orbsoln = 
 Table[NDSolve[{(x''[
    t] + (μ*(x[t][[i]]))/((x[t][[i]])^2 + (y[t][[i]])^2)^(3/2) == 
  0, (y''[
    t] + (μ* (y[t][[i]]))/((x[t][[i]])^2 + (y[t][[i]])^2)^(3/2) ==
   0, x[0] == r[[j]], y[0] == 0, 
    Derivative[1][x][0] == 0, Derivative[1][y][0] == v[[j]]}, {x , 
y}, {t, 0, 2 Pi}], {j, 1, 3}]

The results are then plotted using Animate and rotated into plane using an euler rotation matrix

EulerRotationMatrix[{i_, Ω_, ω_}] := RotationMatrix[
i, {0, 0, 1}].RotationMatrix[Ω, {0, 1, 
 0}].RotationMatrix[ω, {0, 0, 1}];

 plot = Table[
  ParametricPlot3D[
   Evaluate[(EulerRotationMatrix[{RAAN[[m]] Degree, Inc[[m]] Degree, 
     ArgPer[[m]] Degree}].{x[t], y[t], 0}) /. First[orbsoln]], {t,
 0, 2 Pi}, PlotRange -> 0.8*10^7], {m, 1, 3}]

Animate[Show[plot, 
  Graphics3D[{PointSize[0.02], Red, 
    Point[Table[
  Evaluate[(EulerRotationMatrix[{RAAN[[o]] Degree, 
        Inc[[o]] Degree, ArgPer[[o]] Degree}].{x[t], y[t], 0}) /. 
    First[orbsoln]], {o, 1, 3}]]}]], {t, 0, 2 Pi}]

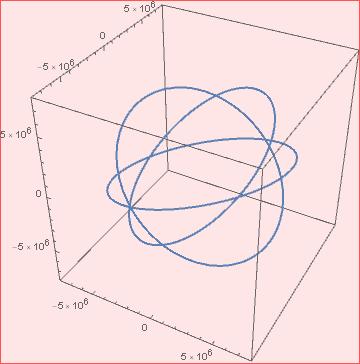
I'm aiming to show 3 points following their parametric path that has been defined by NDsolve, but all i get is this plot;

enter image description here

and the error message

Coordinate {{{6.978455209925671*^6, 1.4717698904511775*^6, 1.9318209890130716*^6}}, {{-1.9573444509619826]^6, -6.669739440694639^6, 2.5060436058655437*^6}}, {{-4.195765089771511*^6, 4.47488342280073*^6, 4.119204986980711*^6}}} should be a triple of numbers, or a Scaled form.

Can anyone point out where I have gone wrong?

$\endgroup$
1
  • $\begingroup$ orbsoln doesn't work properly $\endgroup$
    – Alrubaie
    Commented Mar 29, 2019 at 23:15

2 Answers 2

2
$\begingroup$

Your expression for assigning values to x[t] and y[t] look suspect.

Table[
  {x[t] = a[[i]] (1 - Ecc[[i]]^2)/(1 + Ecc[[i]]*Cos[t])*Cos[t],
    {y[t] = a[[i]] (1 - Ecc[[i]]^2)/(1 + Ecc[[i]]*Cos[t])*Sin[t]}}, 
  {i, 1, 3}]

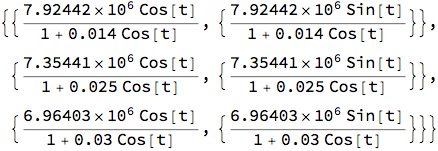
generates

table

but most of that is thrown away;x[t], y[t] are just

Column[{x[t], y[t]}]

column

I find it hard to believe this what you want.

Update

After I spent quite a bit more time studying your code I concluded that main error is in formulating orbsoln. However, I going to ignore it, because I think it might not be necessary for what you want to do.

μ = 3.986004418*10^14;
a = {7.92597218162462`*^6, 7.359004757830201`*^6, 6.970300551929753`*^6};
r = {7.388961739897817`*^6, 7.352270990873303`*^6, 6.989358622500435`*^6};
v = {7589.490674834727`, 7366.424498576473`, 7541.464522475139`};
Ecc = {0.014, 0.025, 0.03};
RAAN = {150, 160, 170};
Inc = {20, 80, 320};
ArgPer = {220, 110, 330};

EulerRotationMatrix[{i_, Ω_, ω_}] := 
  RotationMatrix[i, {0, 0, 1}] . 
    RotationMatrix[Ω, {0, 1, 0}] . 
      RotationMatrix[ω, {0, 0, 1}]

All you really need is the table of orbit expressions written this way.

Block[{t, orbits2D},
  orbits2D =
    Transpose[
      {Table[
         a[[i]] (1 - Ecc[[i]]^2)/(1 + Ecc[[i]]*Cos[t])*Cos[t], {i, 1, 3}],
       Table[
         a[[i]] (1 - Ecc[[i]]^2)/(1 + Ecc[[i]]*Cos[t])*Sin[t], {i, 1, 3}], 
       {0, 0, 0}}];
  orbits3D =
    {orb[1][t_], orb[2][t_], orb[3][t_]} = 
      Table[
        EulerRotationMatrix[
          {RAAN[[m]] Degree, Inc[[m]] Degree, ArgPer[[m]] Degree}].orbits2D[[m]], 
        {m, 1, 3}]];

Now we can make the background plot showing the orbit traces with

plot = ParametricPlot3D[Evaluate @ orbits3D, {t, 0, 2 Pi}];

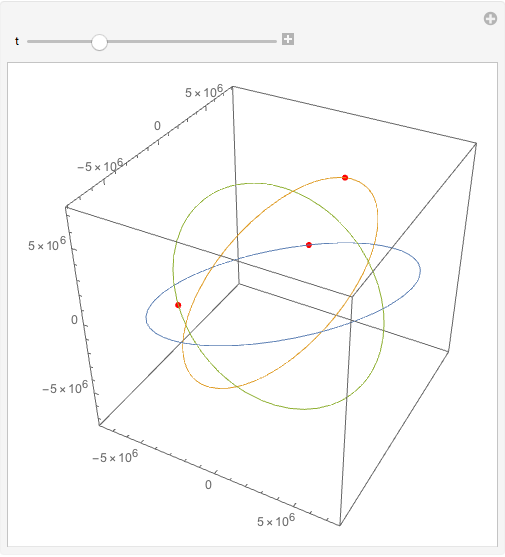
and make a demonstration showing particles following those obits with Manipulate. I leave it to you to convert the Manipulate to an `Animate expression if that's what you prefer. It's an easy exercise.

Manipulate[
 Show[
   plot,
   Graphics3D[{Red, AbsolutePointSize[5], Point[Evaluate[orb[#][t] & /@ Range[3]]]}]],
 {t, 0, 2 Pi}]

demo

Note: As the problem is reformulated here, the independent variable t does not represent time. So this is a purely kinematic solution. The orbital parameters μ, r and v are not used. I think you were trying to get the true dynamics of the orbits with orbsoln, but I find that code so confusing that I don't see how to fix it.

$\endgroup$
1
  • $\begingroup$ Thanks for your reply, im trying to use the individual column values of x[t] and y[t] in NDsolve, i thought this was working as parametric plots were generated for the respective parametric paths. Could you explain why although the paths are generated, the animated points are not? $\endgroup$
    – isaac5122
    Commented Mar 30, 2019 at 9:01
1
$\begingroup$

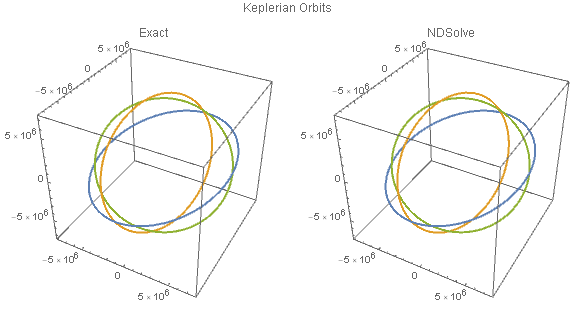
I thought it might be useful as a reference to demonstrate a side-by-side comparison of two ways to visualize Keplerian orbits from their orbital elements, either by using the exact polar equations, or by using ParametricNDSolveValue[]:

μ = QuantityMagnitude[PlanetData["Earth", "GravitationalConstantMassProduct"]];

(* semimajor axes *)
A = {7.92597218162462`*^6, 7.359004757830201`*^6, 6.970300551929753`*^6};
(* eccentricities *)
ε = {0.014, 0.025, 0.03};

(* argument of periapsis *)
ω = {220, 110, 330} °;
(* inclination *)
ι = {20, 80, 320} °;
(* longitude of the ascending node *)
Ω = {150, 160, 170} °;

kepler[a_, e_, θ_] := a (1 - e^2)/(1 + e Cos[θ])

orbit = ParametricNDSolveValue[{r''[t] == -μ r[t]/Norm[r[t]]^3, 
                                r[0] == {a (1 - e), 0}, 
                                r'[0] == {0, Sqrt[μ (1 + e)/(a (1 - e))]}}, 
                               r, {t, 0, 2 π a Sqrt[a/μ]}, {a, e}];

GraphicsRow[{ParametricPlot3D[MapThread[
                       Function[{a, e, Ω, ι, ω},
                                Append[kepler[a, e, θ] AngleVector[θ], 0] .
                                EulerMatrix[{Ω, ι, ω}, {3, 1, 3}]],
                       {A, ε, Ω, ι, ω}] // Evaluate, {θ, 0, 2 π},
                       PlotLabel -> "Exact"],
             ParametricPlot3D[MapThread[Function[{a, e, Ω, ι, ω},
                              Append[IdentityMatrix[2], {0, 0}] .
                              orbit[a, e][a Sqrt[a/μ] t] .
                              EulerMatrix[{Ω, ι, ω}, {3, 1, 3}]],
                              {A, ε, Ω, ι, ω}] // Evaluate, {t, 0, 2 π},
                              PlotLabel -> "NDSolve"]},
            PlotLabel -> "Keplerian Orbits"]

Kepler orbits

$\endgroup$

Your Answer

By clicking “Post Your Answer”, you agree to our terms of service and acknowledge you have read our privacy policy.

Not the answer you're looking for? Browse other questions tagged or ask your own question.