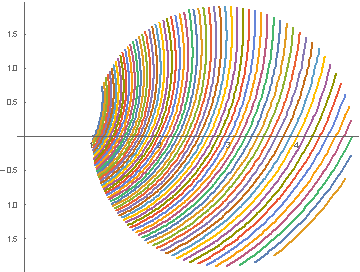
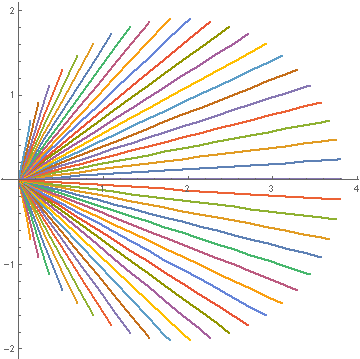
I have 2 tables;
table 1:
ctr = {(Exp[Pi*0.5] + 1)/2, 0};
radius = (Exp[Pi*0.5] - 1)/2;
pp = PolarPlot[
  Evaluate@Table[Exp[(t + 2*Pi*i/120)*0.5], {i, 1, 120}], {t, -Pi,
   Pi}, RegionFunction -> (Norm[{#, #2} - ctr] <= radius &)]
Total[ArcLength /@ Cases[pp, _Line, All]]
and table 2:
ctr = {(Exp[Pi*0.5] - 1)/2, 0};
radius = (Exp[Pi*0.5] - 1)/2;
pp2 = ParametricPlot[
  Evaluate[Table[{t, t (Tan[2 j Pi / 120])}, {j, 1, 60}]], {t, -5, 5},
   RegionFunction -> (Norm[{#, #2} - ctr] <= radius &),
  PlotRange -> All]
Total[ArcLength /@ Cases[pp2, _Line, All]]
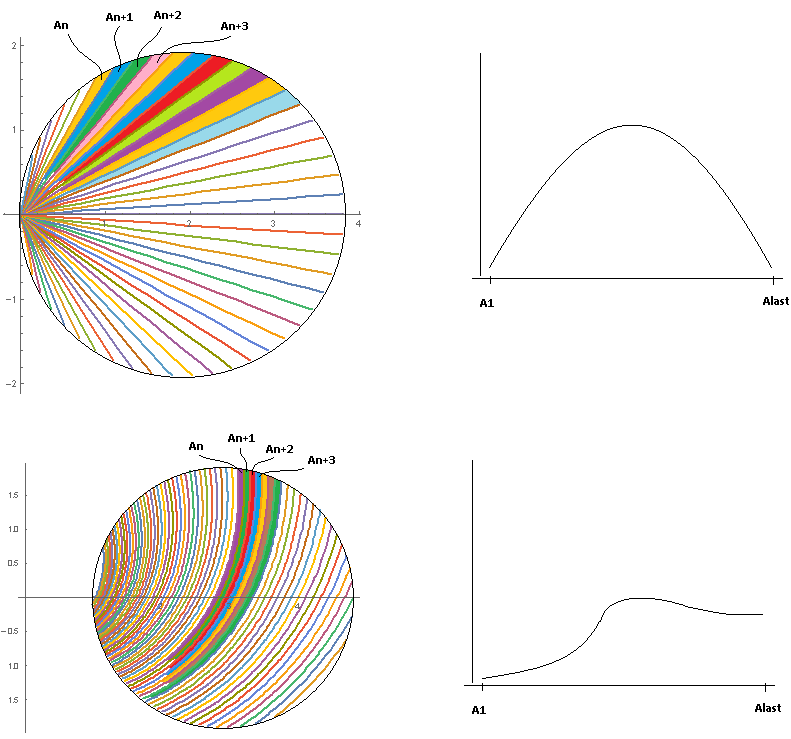
I want to calculate each area between the curves and show them in histogram so I can evaluate maximum and minimum gaps between the tables. I illustrated what I want as below:
can you show me how?


