4
$\begingroup$

I am plotting a contour as

ContourPlot[f[x,y]==f0,{x,0,1},{y,0,1}]

and I want to use my custom ColorFunction->Function[{x,y}, ... ] to color the contour (so that the contour varies its color). So far, I have not succeeded and not found an answer on forums.
Any ideas? Thanks, Sergey

$\endgroup$

1 Answer 1

6
$\begingroup$

You can post-process the output of ContourPlot to extract the lines and create a BSplineFunction for each line, and plot the functions using ParametricPlot with the desired ColorFunction:

cp = ContourPlot[Cos[x] Cos[y] == .1, {x, 0, 4 Pi}, {y, 0, 4 Pi}, 
   ContourStyle -> Thick, ImageSize -> 300];
bsps = Cases[Normal[cp], Line[x_] :> BSplineFunction[x],  All];
pp = ParametricPlot[Evaluate@Through[bsps @ t], {t, 0, 1}, 
   PlotStyle -> Thick, Frame -> True, 
   ColorFunction -> (ColorData["Rainbow"][# + #2] &), 
   ImageSize -> 300];

Row[{Labeled[cp, ContourPlot, Top], Labeled[pp, ParametricPlot, Top]},  Spacer[5]]
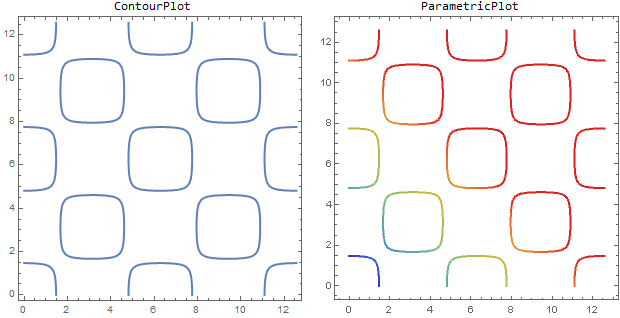
enter image description here

Additional examples:

Row[Table[With[{f = f}, 
   ParametricPlot[Evaluate @ bsps @ t], {t, 0, 1}, 
    PlotStyle -> Thick, Frame -> True, ImageSize -> 300,
    PlotLabel -> HoldForm[f], ColorFunction -> f]], 
  {f, {ColorData["Rainbow"][# #2] &, 
    ColorData["SolarColors"][#3] &, 
    ColorData["TemperatureMap"][# #3] &}}], Spacer[5]]
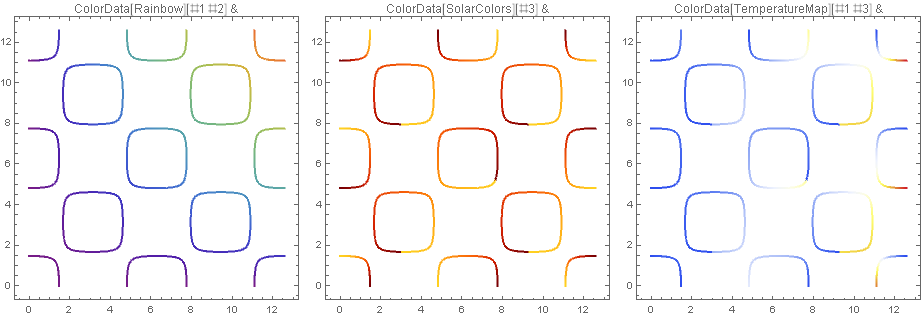
enter image description here

$\endgroup$
1
  • $\begingroup$ Thank you! The solution is much appreciated. In the meanwhile, I have found another workaround, using the RegionPlot[f0<f[x,y]<f0+epsilon, ... ]. But my workaround works much slower. $\endgroup$ Commented Feb 19, 2019 at 15:08

Your Answer

By clicking “Post Your Answer”, you agree to our terms of service and acknowledge you have read our privacy policy.

Not the answer you're looking for? Browse other questions tagged or ask your own question.