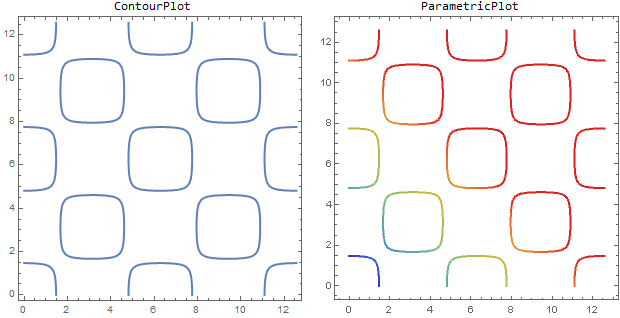
You can post-process the output of ContourPlot to extract the lines and create a BSplineFunction for each line, and plot the functions using ParametricPlot with the desired ColorFunction:
cp = ContourPlot[Cos[x] Cos[y] == .1, {x, 0, 4 Pi}, {y, 0, 4 Pi},
   ContourStyle -> Thick, ImageSize -> 300];
bsps = Cases[Normal[cp], Line[x_] :> BSplineFunction[x],  All];
pp = ParametricPlot[Evaluate@Through[bsps @ t], {t, 0, 1},
   PlotStyle -> Thick, Frame -> True,
   ColorFunction -> (ColorData["Rainbow"][# + #2] &),
   ImageSize -> 300];

Row[{Labeled[cp, ContourPlot, Top], Labeled[pp, ParametricPlot, Top]},  Spacer[5]]

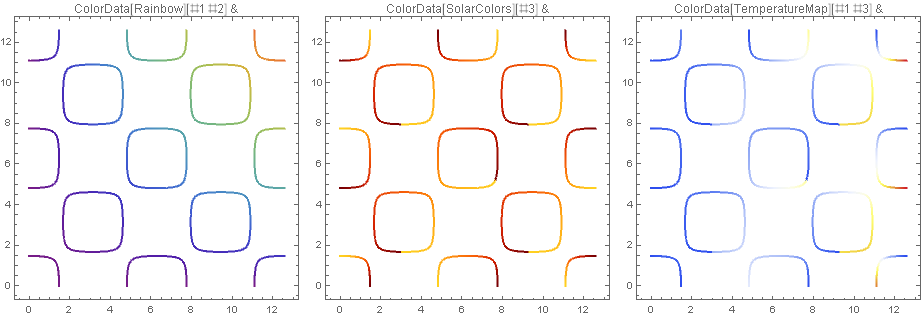
Additional examples:
Row[Table[With[{f = f},
   ParametricPlot[Evaluate @ bsps @ t], {t, 0, 1},
    PlotStyle -> Thick, Frame -> True, ImageSize -> 300,
    PlotLabel -> HoldForm[f], ColorFunction -> f]],
  {f, {ColorData["Rainbow"][# #2] &,
    ColorData["SolarColors"][#3] &,
    ColorData["TemperatureMap"][# #3] &}}], Spacer[5]]


