3
$\begingroup$

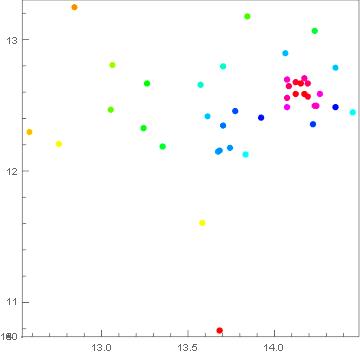
So i have a list of points, and i need them to be colored differently based on how many neighbours they have. I tried:

ListPlot[Nearest[list, list, {Infinity, 2}], 
ImageSize -> Large, AspectRatio -> 1]

but this doesnt work. Anyone have any ideas how to do this?

Thanks in Advance

Update: The List im using is About 6000 numbers long. Here is a part of it:

{{14.24, 12.5}, {14.15, 12.67}, {14.22, 12.36}, {14.17, 12.71}, 
{13.61, 12.42}, {14.35, 12.49}, {14.12, 12.68}, {14.26, 12.59}, 
{14.07, 12.56}, {14.19, 12.57}, {14.06, 12.9}, {14.17, 12.59}, 
{14.19, 12.67}, {14.23, 12.5}, {14.07, 12.49}, {14.45, 12.45}, {13.7, 
12.8}, {14.12, 12.59}, {14.07, 12.7}, {14.23, 13.07}, {13.83, 12.13}, 
{14.35, 12.79}, {13.92, 12.41}, {14.08, 12.65}, {13.68, 12.16}, 
{13.84, 13.18}, {13.58, 11.61}, {12.58, 12.3}, {12.84, 13.25}, 
{13.57, 12.66}, {13.74, 12.18}, {13.24, 12.33}, {13.05, 12.47}, 
{13.26, 12.67}, {13.7, 12.35}, {13.68, 10.79}, {13.35, 12.19}, 
{13.77, 12.46}, {13.67, 12.15}, {12.75, 12.21}, {13.06, 12.81}}
$\endgroup$
1
  • 1
    $\begingroup$ To make it easy for us to help you it's always a good idea to post a (reasonable) data set representative of your own. As it stands, you depend on the kindness of strangers to make a guess at a suitable lst for you. $\endgroup$ Commented Feb 6, 2019 at 17:48

3 Answers 3

3
$\begingroup$
nc = Length /@ Nearest[list, list, {Infinity, 2}];
minmax = MinMax[nc];
legend = SwatchLegend[ColorData[{"Rainbow", minmax}] /@ Union[nc], 
   Union@nc, LegendLabel -> "Neighbor Counts", 
   LegendLayout -> {"Row", 1}, LegendMarkers -> "Bubble"];

ListPlot

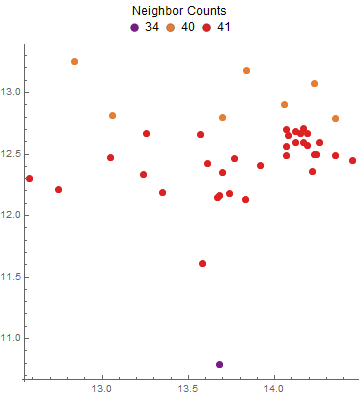
You can wrap each data point with List and use the option PlotStyle to style each point differently:

ListPlot[List /@ list, 
 PlotStyle -> (Directive[PointSize[Large], ColorData[{"Rainbow", minmax}]@#] & /@ nc), 
 PlotLegends -> Placed[legend, Top], 
 ImageSize -> Medium, AspectRatio -> 1, PlotRange -> All]

enter image description here

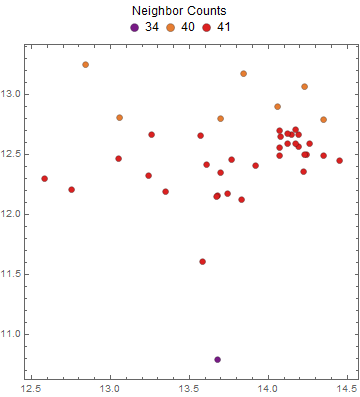
Alternatively, you can style each data point differently by wrapping it with Style as in Jon's answer:

ListPlot[Style[#, ColorData[{"Rainbow", minmax}][#2]] & @@@ Transpose[{list, nc}],
 PlotLegends -> Placed[legend, Top], BaseStyle -> PointSize[Large], 
 ImageSize -> Medium, AspectRatio -> 1, PlotRange -> All]

same picture

BubbleChart

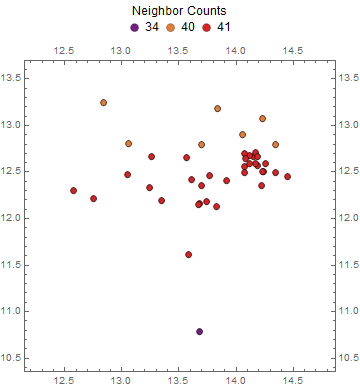
You can also use BubbleChart by appending to each data point its neighbor count:

BubbleChart[Join[list, List /@ nc,  2], ColorFunction -> "Rainbow", 
 BubbleSizes -> {.02, .02}, ChartLegends -> Placed[legend, Top]]

enter image description here

RelationGraph

rg = RelationGraph[EuclideanDistance[##] <= 2 &, list];
cols = ColorData[{"Rainbow", MinMax@#}] /@ # &[1 + DegreeCentrality[rg]];
Legended[Graph[rg, 
  VertexSize -> {Divide @@ (Subtract @@@ CoordinateBounds[list]), 1}/30, 
  VertexCoordinates -> list, 
  EdgeStyle -> Opacity[0], 
  VertexStyle -> Thread[VertexList[rg] -> cols], Frame -> True, 
  FrameTicks -> All, AspectRatio -> 1], Placed[legend, Top]]

enter image description here

$\endgroup$
3
$\begingroup$

Something like this will work - choose your own styling function...

nearCount[pt_, list_, dist_] := Length[Nearest[list, pt, {Infinity, dist}]];
styleByCount[pt_] := Style[pt, GrayLevel[nearCount[pt, list, 0.2]/15]];
ListPlot[styleByCount /@ list]
$\endgroup$
2
$\begingroup$

With your data = dat define a measure function between points. This is arbitrary.

measure[p1_, p2_] := 1/(.1 + Norm[p1 - p2]);

Assume a point's total measure is the sum of the measures between points. Get the total measures of points.

outerRes = Total@Outer[measure[#1, #2] &, dat, dat, 1]

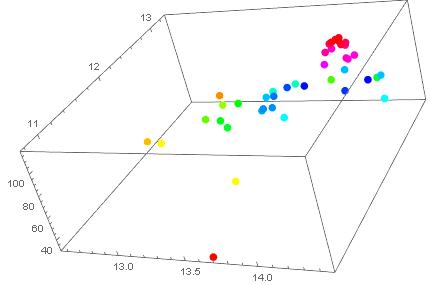
Extend our data to 3D

augdat = Transpose@Join[Transpose[dat], {outerRes}];

Look at 3D plot (fun)...

ListPointPlot3D[augdat, 
          ColorFunction -> Function[{x, y, z}, Hue[z]]
          ]

enter image description here

Looking down from directly overhead by setting Viewpoint to get 2D view.

ListPointPlot3D[augdat,
  ColorFunction -> Function[{x, y, z}, Hue[z]],
  ViewPoint -> {0, 0, Infinity}]

enter image description here

$\endgroup$

Your Answer

By clicking “Post Your Answer”, you agree to our terms of service and acknowledge you have read our privacy policy.

Not the answer you're looking for? Browse other questions tagged or ask your own question.