4
$\begingroup$

I've got the problem with checking if Laguerre polynomials for n=1,...,10 are orthogonal.

I have to create the list of these polynomials, then create the matrix of integrals from 0 to infinity. Something like:

M=Integrate[LaguerreL[i,x] LaguerreL[j,x] Exp[-x], {x,0,Infinity}] 

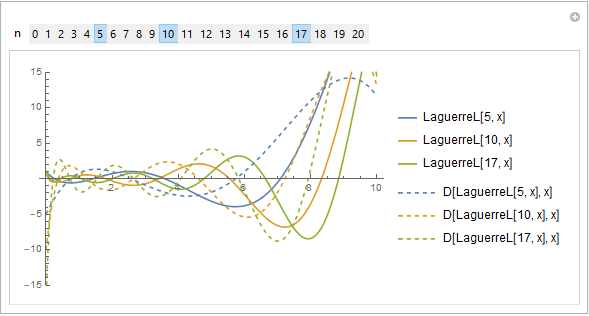
And in the end I have to draw the dynamic drawing of these polynomials so that if I choose on graph n, from 0 to 20, the correct polynomial will be drawn with its derivative.

$\endgroup$
4
  • $\begingroup$ Related: mathematica.stackexchange.com/questions/155030/… $\endgroup$
    – Michael E2
    Commented Nov 29, 2018 at 4:44
  • $\begingroup$ Table[M, {i, 10}, {j, 10}]? $\endgroup$
    – Michael E2
    Commented Nov 29, 2018 at 4:45
  • $\begingroup$ I have to integrate by exp(-x)dx instead of dx. $\endgroup$
    – Crunchy
    Commented Nov 29, 2018 at 4:57
  • 1
    $\begingroup$ That's not the problem.... $\endgroup$
    – Michael E2
    Commented Nov 29, 2018 at 5:20

2 Answers 2

7
$\begingroup$
Integrate[LaguerreL[i, x] LaguerreL[j, x] Exp[-x], {x, 0, Infinity}, 
 Assumptions -> Element[{i, j}, Integers] && j > i > 0]

0

n = 10;
Outer[Integrate[LaguerreL[#, x] LaguerreL[#2, x] Exp[-x], {x, 0, ∞}] &, 
  Range[n], Range[n]] == IdentityMatrix[n]

True

Manipulate[Show[Plot[Evaluate@LaguerreL[Sort@n, x], {x, 0, 10}, 
   PlotLegends -> ("LaguerreL[" <> ToString[#] <> ", x]" & /@ Sort[n]), 
   PlotRange -> {-15, 15}], 
  Plot[Evaluate[D[LaguerreL[Sort@n, z], z] /. z -> x], {x, 0, 10}, 
   PlotLegends -> ("D[LaguerreL[" <> ToString[#] <> ", x], x]" & /@ Sort[n]), 
   PlotStyle -> Dashed]],
 {{n, {5, 10, 17}}, Range[0,20], TogglerBar}]

enter image description here

$\endgroup$
3
$\begingroup$
Table[
 NIntegrate[LaguerreL[i, x] LaguerreL[j, x] Exp[-x], {x, 0, Infinity}],
 {i, 10},
 {j, 10}
] // Chop // Quiet
MatrixForm@%
Manipulate[
 Plot[
  {#, D[#, x]} &@LaguerreL[n, x] // Evaluate,
  {x, 0, 10},
  Frame -> True,
  BaseStyle -> {11, FontFamily -> Times},
  PlotLabel -> StringForm["n=``", n]
 ],
{n, 0, 20, 1, PopupMenu}
]

{{1., 0, 0, 0, 0, 0, 0, 0, 0, 0}, {0, 1., 0, 0, 0, 0, 0, 0, 0, 0}, {0, 0, 1., 0, 0, 0, 0, 0, 0, 0}, {0, 0, 0, 1., 0, 0, 0, 0, 0, 0}, {0, 0, 0, 0, 1., 0, 0, 0, 0, 0}, {0, 0, 0, 0, 0, 1., 0, 0, 0, 0}, {0, 0, 0, 0, 0, 0, 1., 0, 0, 0}, {0, 0, 0, 0, 0, 0, 0, 1., 0, 0}, {0, 0, 0, 0, 0, 0, 0, 0, 1., 0}, {0, 0, 0, 0, 0, 0, 0, 0, 0, 1.}}

$\left( \begin{array}{cccccccccc} 1. & 0 & 0 & 0 & 0 & 0 & 0 & 0 & 0 & 0 \\ 0 & 1. & 0 & 0 & 0 & 0 & 0 & 0 & 0 & 0 \\ 0 & 0 & 1. & 0 & 0 & 0 & 0 & 0 & 0 & 0 \\ 0 & 0 & 0 & 1. & 0 & 0 & 0 & 0 & 0 & 0 \\ 0 & 0 & 0 & 0 & 1. & 0 & 0 & 0 & 0 & 0 \\ 0 & 0 & 0 & 0 & 0 & 1. & 0 & 0 & 0 & 0 \\ 0 & 0 & 0 & 0 & 0 & 0 & 1. & 0 & 0 & 0 \\ 0 & 0 & 0 & 0 & 0 & 0 & 0 & 1. & 0 & 0 \\ 0 & 0 & 0 & 0 & 0 & 0 & 0 & 0 & 1. & 0 \\ 0 & 0 & 0 & 0 & 0 & 0 & 0 & 0 & 0 & 1. \\ \end{array} \right)$

$\endgroup$
2
  • $\begingroup$ Thank you! :) Can this graph be simply modified? For example, when I increase n, on the graph will be shown graphs 1,2,3 to n, all of them on one graph? $\endgroup$
    – Crunchy
    Commented Nov 29, 2018 at 6:14
  • $\begingroup$ @Crunchy Sure, just change Plot[{#, D[#, x]} &@LaguerreL[n, x] to Plot[{#, D[#, x]} &@LaguerreL[Range[0, n], x]. Though, it starts to look a little chaotic even at n=4. At that point, I would go with @kglr's implementation. $\endgroup$ Commented Nov 29, 2018 at 20:47

Your Answer

By clicking “Post Your Answer”, you agree to our terms of service and acknowledge you have read our privacy policy.

Not the answer you're looking for? Browse other questions tagged or ask your own question.