0
$\begingroup$

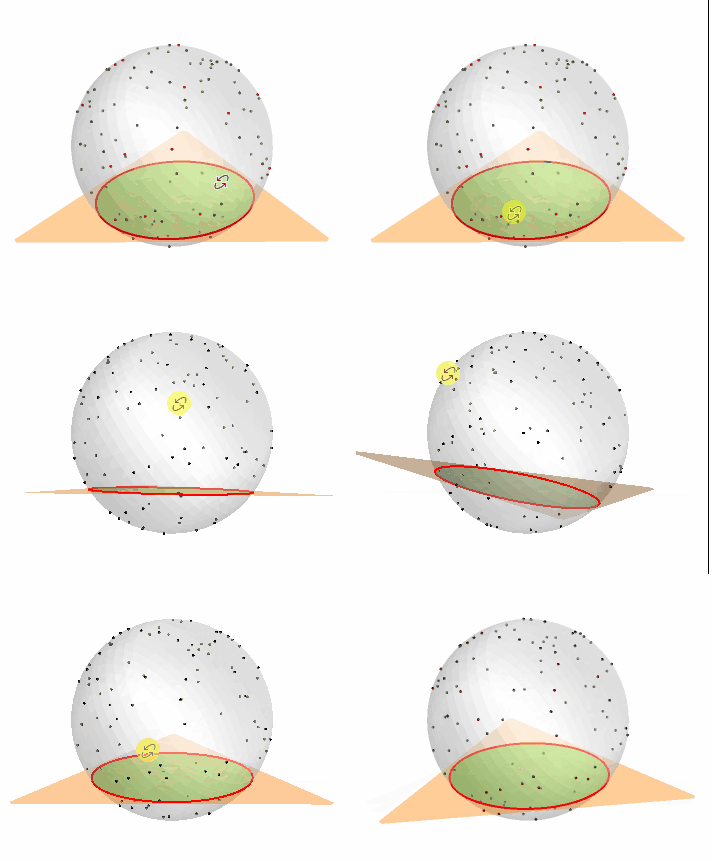
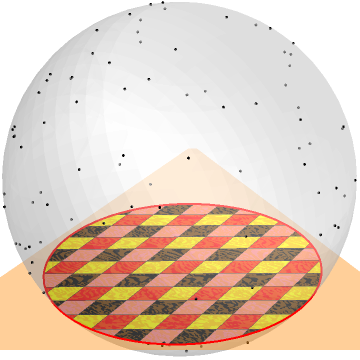
I want to draw a semi-transparent ball and highlight its intersection with a plane.

ℛ = ImplicitRegion[x^2 + y^2 + z^2 <= 1 , {x, y, z}];

r3d = 
  RegionPlot3D[ℛ, 
    PlotRange -> {{-1.5, 1.5}, {-1.5, 1.5}, {-1.6, 1.6}}, 
    PlotPoints -> 30]

inter = 
  Region[RegionIntersection[ℛ, InfinitePlane[{{1, 0, 0}, {0, 1, 0}, {0, 0, 1}}]]]

Now why won't this work?

RegionPlot3D[inter, 
  PlotRange -> {{-1.5, 1.5}, {-1.5, 1.5}, {-1.6, 1.6}},  
  PlotPoints -> 30]

I have a implicit region and a plane, I form the intersection, but I'm unable to plot it.

$\endgroup$

1 Answer 1

1
$\begingroup$

On the one hand inter is already a Region and need not be wrapped by RegionPlot3D. RegionPlot3D wants to have a boolean expression as first argument; since an ImplicitRegion essentially consists of such a boolean expression, RegionPlot3D was also overloaded for ImplicitRegions.

On the other hand, is a ImplicitRegion; these are not plotted automatically. But you can turn it into a Region with Region[ℛ] to obtain a preview or apply DiscretizeRegion or DiscretizeBoundaryRegion to compute polyhedral approximations.

As side remark: RegionPlot3D was introduced in version 6.0 while Region was introduced in version 11.1. So RegionPlot3D follows an older mechanic; it was not meant as displaying/plotting function for Regions, even if the name might suggest that.

$\endgroup$

Your Answer

By clicking “Post Your Answer”, you agree to our terms of service and acknowledge that you have read and understand our privacy policy and code of conduct.

Not the answer you're looking for? Browse other questions tagged or ask your own question.