1
$\begingroup$

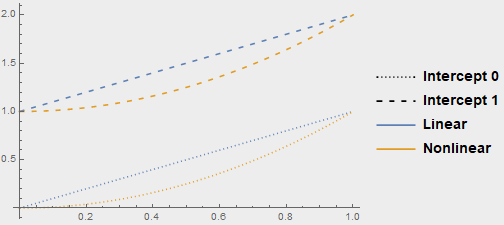
When plotting the following,

p1 = Plot[{x, x^2}, {x, 0, 1}, PlotStyle -> Dashing[Tiny],PlotRange->{0,2}]
p2 = Plot[{x + 1, x^2 + 1}, {x, 0, 1}, PlotStyle -> Dashing[Medium]]
Show[p1, p2]

in Show I want to use dash style to indicated "intercept 0" and "intercept 1", and color style to indicate "linear" and "non-linear". Is it possible to achieve that?

$\endgroup$
4
  • $\begingroup$ I'm not sure I understand what you need. What are intercept 0 and 1? And what do you mean with color style/dash style? Do you want the two linear functions to be solid and the two quadratic function to be dashed? Please clarify what you need in the question by editing it. $\endgroup$
    – Fraccalo
    Commented Sep 10, 2018 at 8:10
  • $\begingroup$ @Fraccalo the two curves in p1 both have an intercept 0, and the two curvees in p2 both have an intercept 1. Because of your question, I am no longer sure whether this is a correct statement. $\endgroup$
    – Glenn
    Commented Sep 10, 2018 at 8:27
  • $\begingroup$ @Glenn Do you mean how to add labels? $\endgroup$
    – Coolwater
    Commented Sep 10, 2018 at 8:28
  • $\begingroup$ @Collwater, I think what I want is to show differences in the most straightforward way. I do not have a preference for label or legends here. $\endgroup$
    – Glenn
    Commented Sep 10, 2018 at 8:35

1 Answer 1

0
$\begingroup$
legends = Plot[{0, 0, 0, 0}, {x, 0, 1}, PlotRange -> {{1, 2}, {1, 2}}, 
      PlotStyle -> {Directive[Dashing[Tiny], Black], Directive[Dashing[Medium], Black],
                    ColorData[97, "ColorList"][[1]], ColorData[97, "ColorList"][[2]]},
    PlotLegends -> {"Intercept 0", "Intercept 1", "Linear", "Nonlinear"}];

Show[p1, p2, legends, PlotRange -> All]

$\endgroup$

Your Answer

By clicking “Post Your Answer”, you agree to our terms of service and acknowledge you have read our privacy policy.

Not the answer you're looking for? Browse other questions tagged or ask your own question.