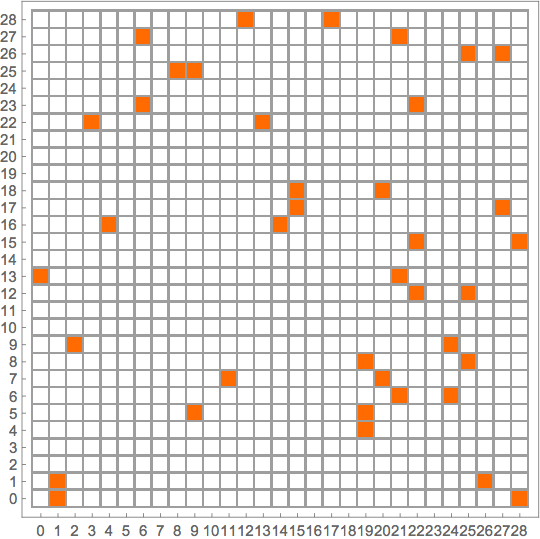
Is there a way to use a finite field for plotting functions in Mathematica? I couldn't find any options in the documentation.
$\begingroup$
$\endgroup$
2
-
2$\begingroup$ Could you please be more specific and give a concrete example of what you are looking for ? $\endgroup$– LotusCommented Aug 21, 2018 at 9:14
-
$\begingroup$ 'f[u_, v_] = v^2 + (u^2 + u) v - (u^5 + u^3 + 1) ContourPlot[f[x, y] == 0, {x, -2, 4}, {y, -5, 5}' Where I want 'ContourPlot' to use a finite field as domain. $\endgroup$– Simon IversenCommented Aug 21, 2018 at 9:18
Add a comment
|
1 Answer
$\begingroup$
$\endgroup$
2
Not sure whether this is what you want.
p = Prime[10];
field = Range[0, p - 1];
f[u_, v_] := Mod[v^2 + (u^2 + u) v - (u^5 + u^3 + 1), p];
solutionQ = Subtract[1, Unitize[Outer[f, field, filed]]];
solutionQ contains a 1 in those positions that belong to a solution pair {u,v}.
Plotting:
MatrixPlot[
 solutionQ,
 FrameTicks -> {
   Transpose[{Range[Length[field]], field}],
   Transpose[{Range[Length[field]], field}]
   },
 DataReversed -> True,
 Mesh -> All
 ]
-
$\begingroup$ That's exactly the thing I'm looking for. Thank you! $\endgroup$ Commented Aug 21, 2018 at 12:33
-

