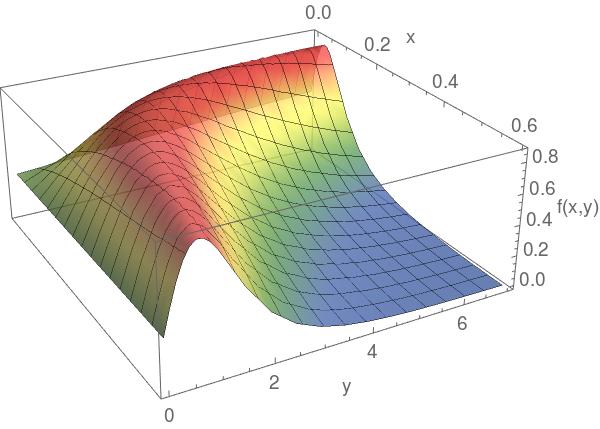
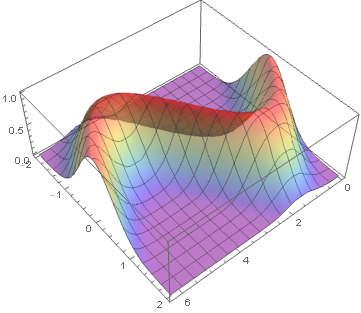
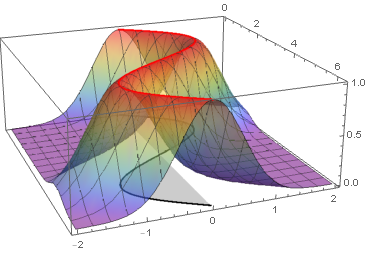
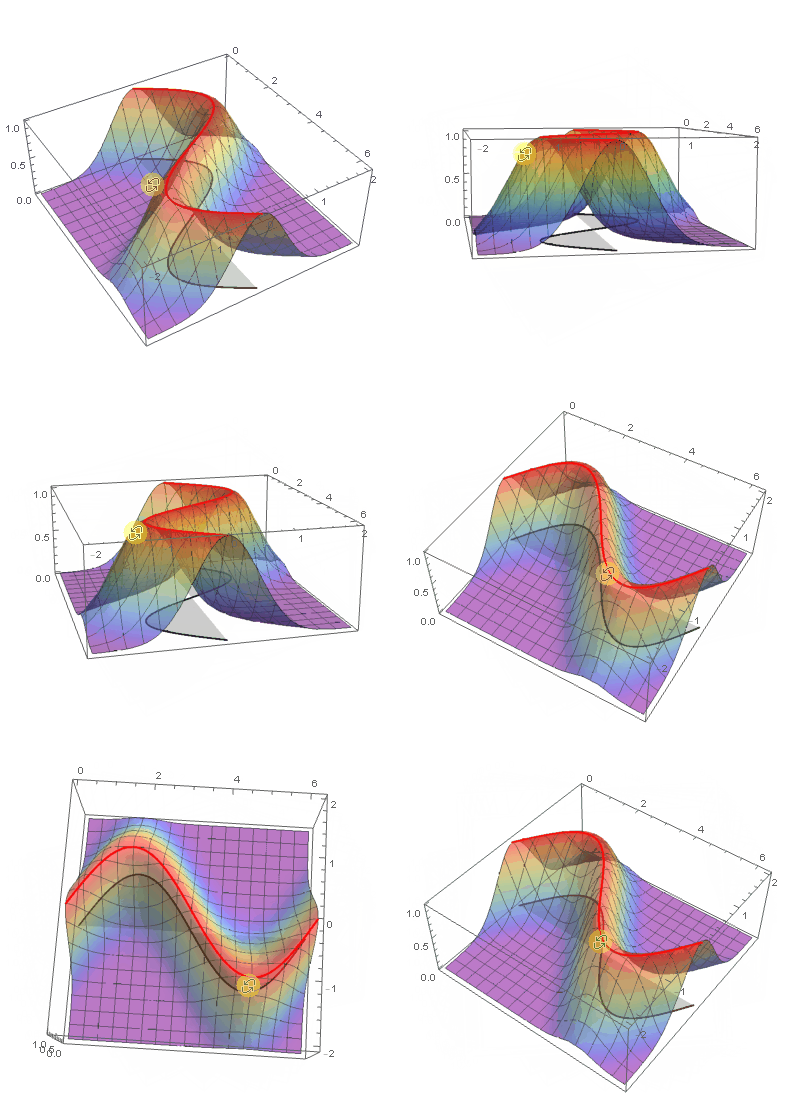
so i have a function $f(x,y)$ (sorry i cannot provide the whole function, it is long transfer matrix function) which i have plotted onto a 3D plot to identify the max values of the function. In addition the variables $x$ and $y$ are constrained $0<x<0.6$ and $0<y<7$
i am looking for a way to plot the $f(x,y)_{MAX}$ (the red region) as a 2D plot $x$ Vs $y$. And hopefully combine it with the 3D plot.
I have already tried to use NMaximize and MaxValue functions but have failed. Any help will be greatly appreciated.
Thank you in advance

