Is there an easy way(other than painfully decomposing into Cartesian components) to plot a vector field in polar coordinates? Basically I have a vector function $\vec V (r,\phi,z)$. How do I plot it ?
2 Answers
You can use CoordinateTransform to transform between different coordinate systems. Beware that you might have to use the differential of certain coordinate transformation in order to transform the vector components of the vector field appropriately
Φ = {x, y, z} \[Function] Evaluate[CoordinateTransform["Cartesian" -> "Cylindrical", {x, y, z}]];
Ψ = {r, ϕ, z} \[Function] Evaluate[CoordinateTransform["Cylindrical" -> "Cartesian", {r, ϕ, z}]];
DΨ = {r, ϕ, z} \[Function] Evaluate[D[Ψ[r, ϕ, z], {{r, ϕ, z}, 1}]];
Mathematically, this is
$$ \varPhi \colon \mathbb{R}^3 \to {[0,\infty[} \times {]-\pi,\pi[} \times \mathbb{R}, \quad \varPhi(x,y,z) = \left(\sqrt{x^2+y^2},\arctan(x,y),z \right)$$
and
$$ \varPsi \colon {[0,\infty[} \times {]-\pi,\pi[} \times \mathbb{R} \to \mathbb{R}^3, \quad \varPsi(r ,\varphi,z) = \left(r \,\cos(\varphi),r \, \sin(\varphi),z \right)$$
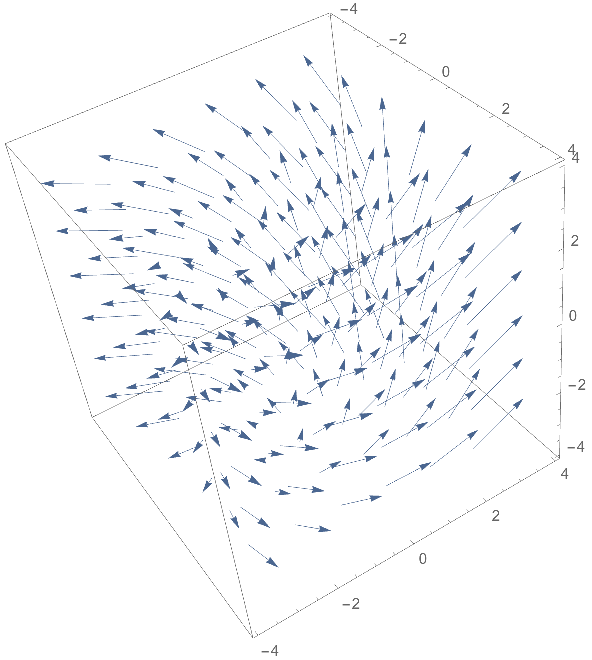
Here is a vector field V in cylindrical coordinates and its transformation into cartesian coordinates.
V = {r, ϕ, z} \[Function] {r, 1, 3};
F = {x, y, z} \[Function] Evaluate[(DΨ @@ Φ[x, y, z]).V @@ Φ[x, y, z]];
In polar coordinates, V has to be interpreted as a mapping with values in the tangent bundle of ${[0,\infty[} \times {]-\pi,\pi[} \times \mathbb{R}$:
$$V \colon {[0,\infty[} \times {]-\pi,\pi[} \times \mathbb{R} \to T({[0,\infty[} \times {]-\pi,\pi[} \times \mathbb{R}), \quad V(r,\varphi,z) = \left(r \tfrac{\partial}{\partial r} + \tfrac{\partial}{\partial \varphi} + 3\, \tfrac{\partial}{\partial z} \right) \Big|_{(r,\varphi,z)}.$$
It has to be transformed like this:
$$F(x,y,z) = D\varPsi(\varPhi(x,y,z)) \cdot V(\varPhi(x,y,z)).$$
And this is the plot:
R = Pi;
VectorPlot3D[
 F[x, y, z], {x, -R, R}, {y, -R, R}, {z, -R, R},
 VectorStyle -> Arrowheads[0.02],
 VectorScale -> 0.15,
 VectorPoints -> 6
 ]
-
$\begingroup$ I am an amateur at using mathematica. Can you please tell me what the function V is in the code above? I couldn't spot any explicit definition for it $\endgroup$– LelouchCommented May 12, 2018 at 16:45
-
$\begingroup$ @Lelouch
V = Function[{r, ϕ, z}, {r, 1, 3}];$\endgroup$– b3m2a1Commented May 12, 2018 at 16:59 -
$\begingroup$ Again, sorry for asking , can you explicitly write the function and domain in mathematical form. I haven't used coordinate transform before. $\endgroup$– LelouchCommented May 12, 2018 at 17:38
-
$\begingroup$ Your result is different from the one given by Conor in the answer below… which one is correct? $\endgroup$– xzczd ♦Commented Mar 26, 2020 at 9:38
-
$\begingroup$ @xzczd Hmm. I am pretty sure that Conor's solution is wrong: I think so because in Conor's solution, the vector field $\tfrac{\partial}{\partial \varphi}$ (which corresponds to in cylindrical coordinates
{0,1,0}) seems to have magnitude independent of $r$ when "transformed" to Euclidean coordinates. But it should have magnitude equal to $r$, no? $\endgroup$ Commented Mar 26, 2020 at 9:57
Mathematica needs a coordinate-system option in VectorPlot.
For now a nice way to plot non-Cartesian fields is to use TransformedField which handles scalar, vector and even tensor fields.
Consider the cylindrical field used above.
{r, 1, 3}
we can very cleanly and without any thinking turn this into its Cartesian representation:
TransformedField["Cylindrical" -> "Cartesian",

                {r, 1, 3}

              , {r, \[Phi], \[Zeta]} -> {x, y, z}]
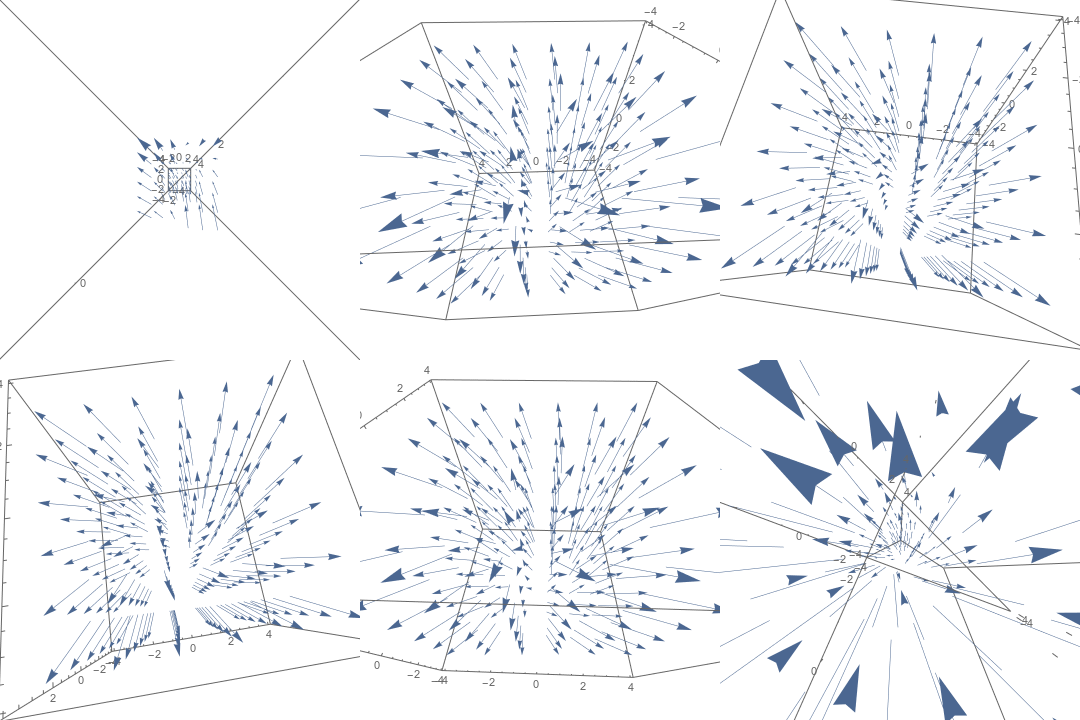
and then plot it (like above)
VectorPlot3D[{x - y/Sqrt[x^2 + y^2], y + x/Sqrt[x^2 + y^2], 3}, {x, -\[Pi], \[Pi]}, {y, -\[Pi], \[Pi]}, {z, -\[Pi], \[Pi]}, VectorStyle -> Arrowheads[0.02], VectorScale -> 0.15, VectorPoints -> 6]
The coordinate-system option in Div, Grad, Laplacian etc. is excellent and it would be nice if this was incorporated into VectorPlot:


